LTC/USD and EOS/USD moving sideways
LTC/USD
From yesterday when Litecoin was at $81.894 the price hasn’t changed much as its currently being traded at around $81.
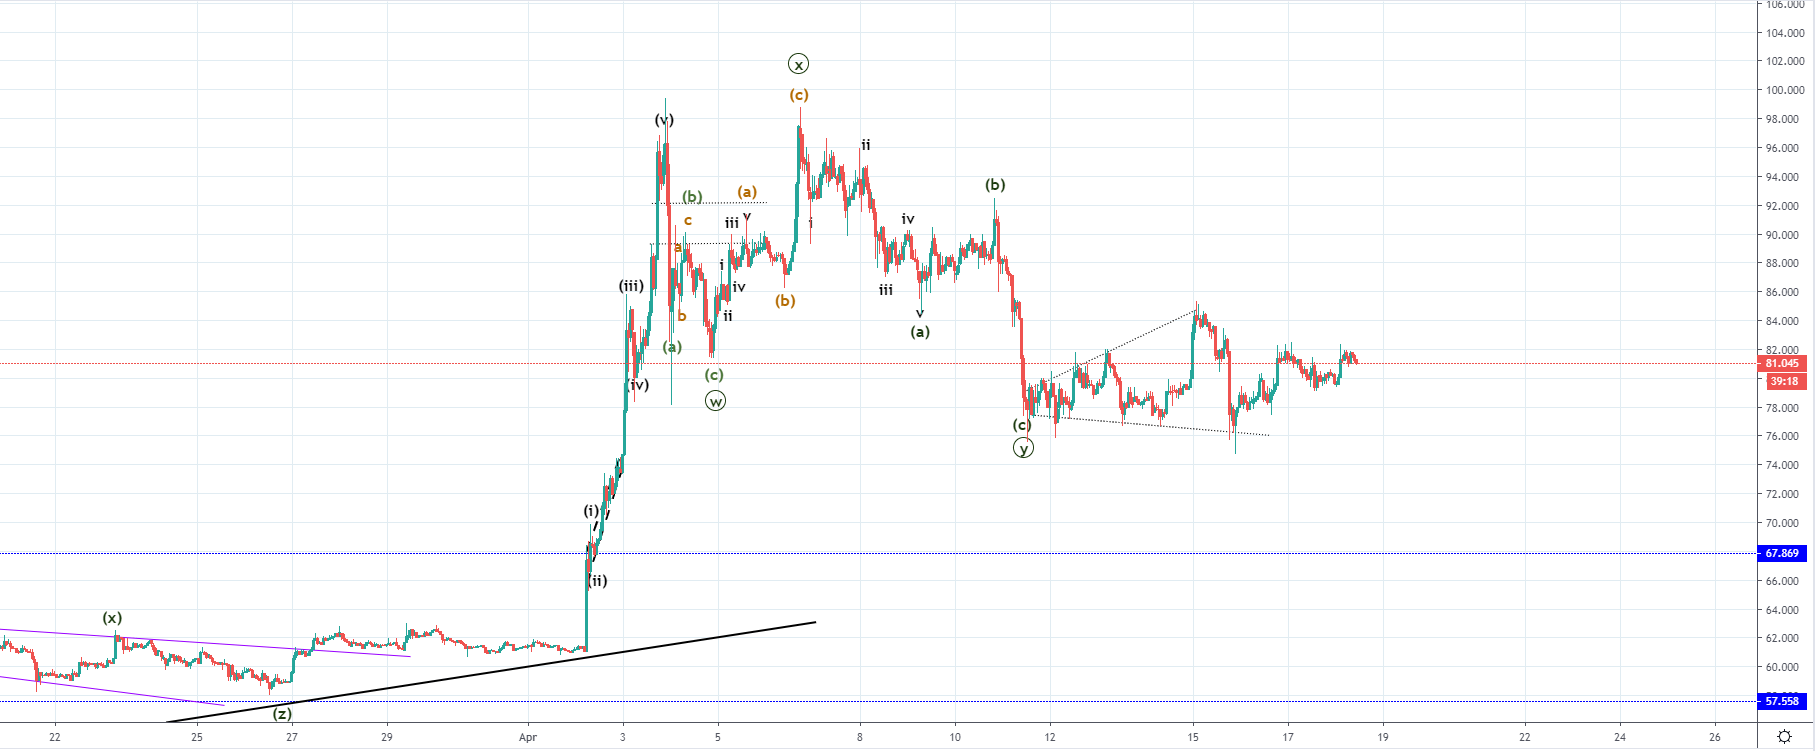
On the hourly chart, you can see that the price of Litecoin has been moving sideways from the 12th of April when a decrease with strong momentum has been made. As the price previously ended its impulsive move to the upside, a correction started developing out of which we have seen three waves. This means that I could have ended with the current structure being a consolidative range before finally the next move to the upside would start.
As you can see, the current structure is an expanding one with higher highs and lower lows. But since Monday when an interaction has been made with the support level, the price has been in an upward trajectory but still hasn’t come above the prior high level before encountering significant resistance.
This is why we are soon to see if the structure would be a continuation of the correction started on 3rd of April as now we are most likely going to see a move to the downside. It could lead the price for a breakout to the downside. But if the price finds support above the prior low at $76.65 horizontal support level and starts increasing again a breakout to the upside would be expected.
EOS/USD
From yesterday’s level of $5.5613 the price of EOS has fallen by 2.67% on yesterday’s low but then started increasing again and managed to pull back up to the levels from which the decrease was made. It is currently sitting around $5.515.
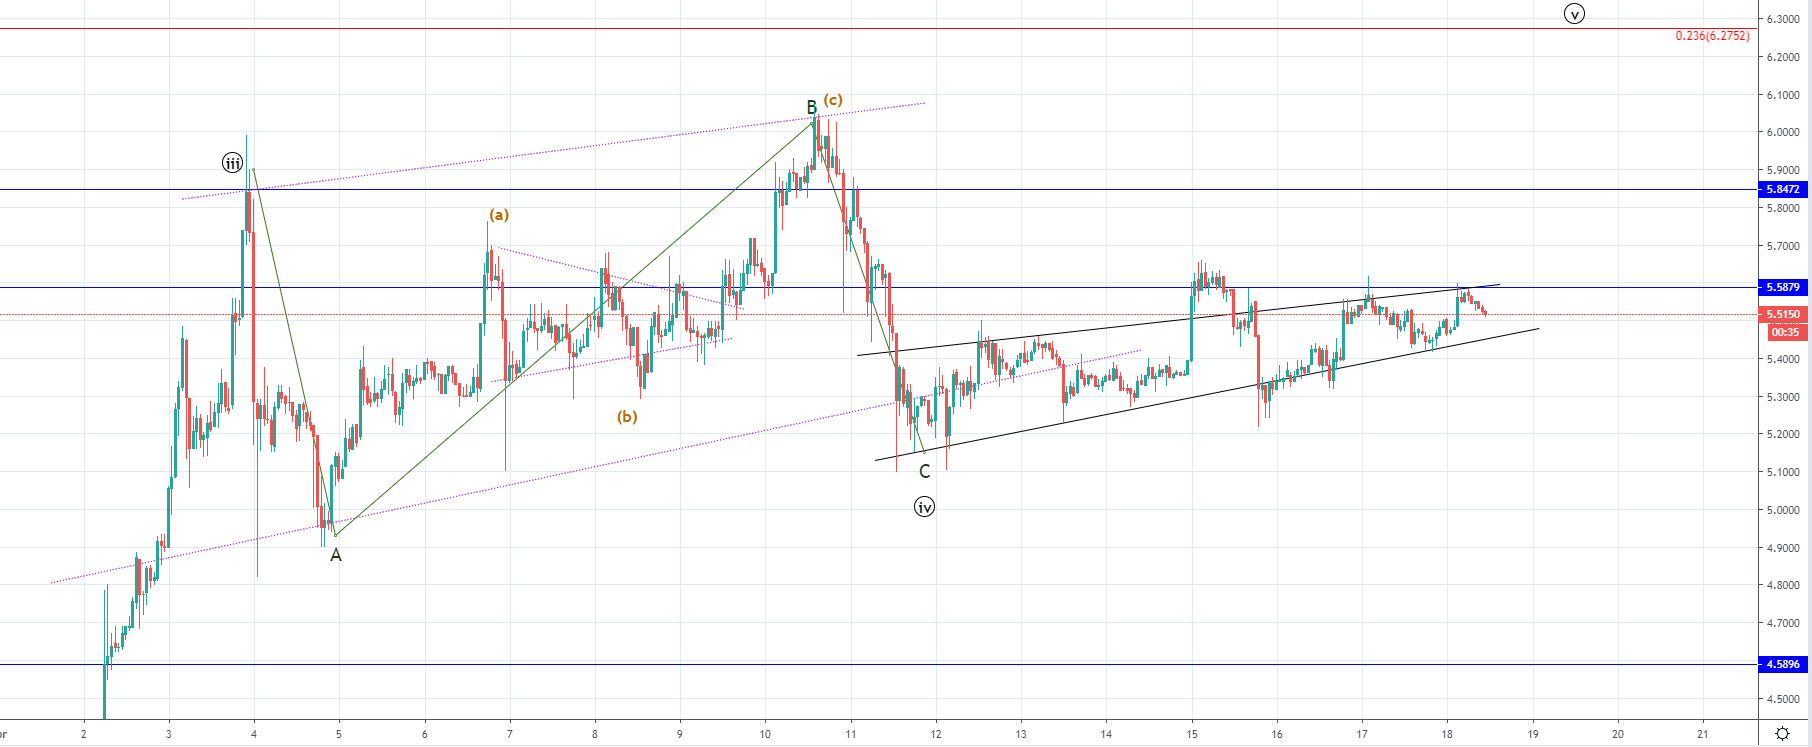
On the hourly chart, you can see a similar chart pattern like that one on the Litecoin’s chart in a sense that a three-wave correction took place before the current structure which is in the case of EOS an ascending one. As prior to the formation of the current ascending structure, a strong move to the downside was made in which the price of EOS decreased by over 14%, the ascending structure could be the part of the same correction and has served as a retest of the broken support at around $5.58 which got retested today again.
The retest ended as another third rejection which could be the final one before we see a breakout to the downside and a continuation of the mentioned three-wave correction. But it could also be some consolidative price action before the 5th wave impulse to the upside starts. This is why the significant pivot point would be at the mentioned horizontal resistance level at around $5.58. And if the price manages to come above it the bullish scenario would be in play.
If the price starts decreasing now after another encounter with the horizontal resistance and goes below the currently seen ascending support line a bearish scenario would be in play as we are in that case most likely seeing the continuation of the correctional structure that started on 3rd of April.