Cryptocurrency pairs LTC/USD and EOS/USD: Reversal expected
LTC/USD Technical Analysis
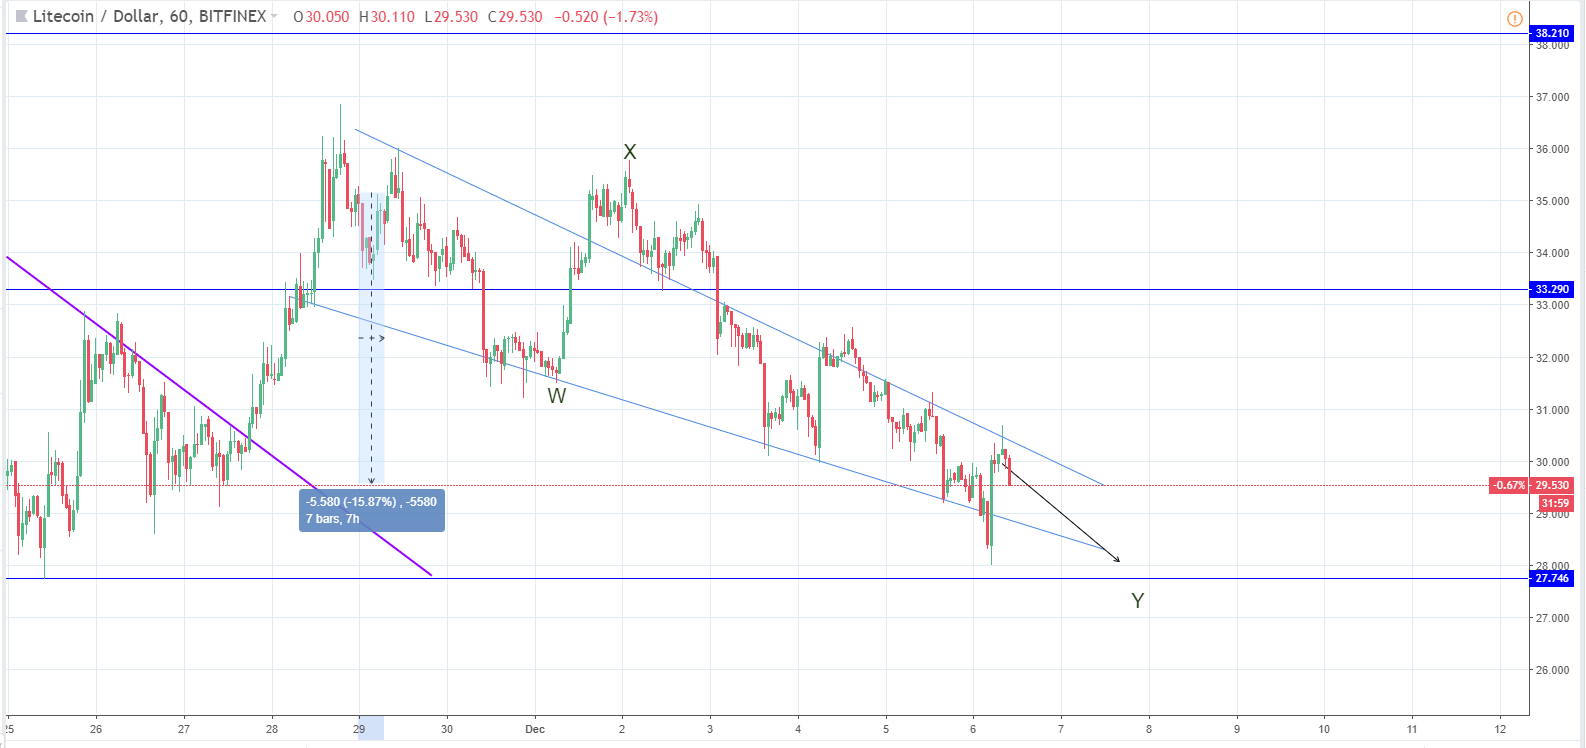
Since our last week analysis on Thursday, November 29th, when the price of Litecoin was at $35.14 measured to the current levels at around $29.6, the cryptocurrency has decreased in value by 15.87%.
Looking at the hourly chart, you can see that the price didn’t go down in a straight line. Instead, the price fell at first to around $32, which was considered to be a higher high at the time a normal retracement after the upswing that broken the prior downtrend resistance. But as you can see the price increased again after establishing support but failed to exceed the prior high as it came to $35.4 area again and was stopped out.
Since the price encountered resistance at the prior high level, it has started decreasing again. And as it came down to $32 level again it was a turning point, but the price broke that support level from the downside and the price continued decreasing outlining a descending channel.
As you can see I have labeled this move as a WXY correction, and as the Y wave needs to end, I would expect more downside from here potentially to the $27.7 level or even a bit lower. But as the Y wave ends on the support line, an increase would be expected from there.
EOS/USD Technical Analysis
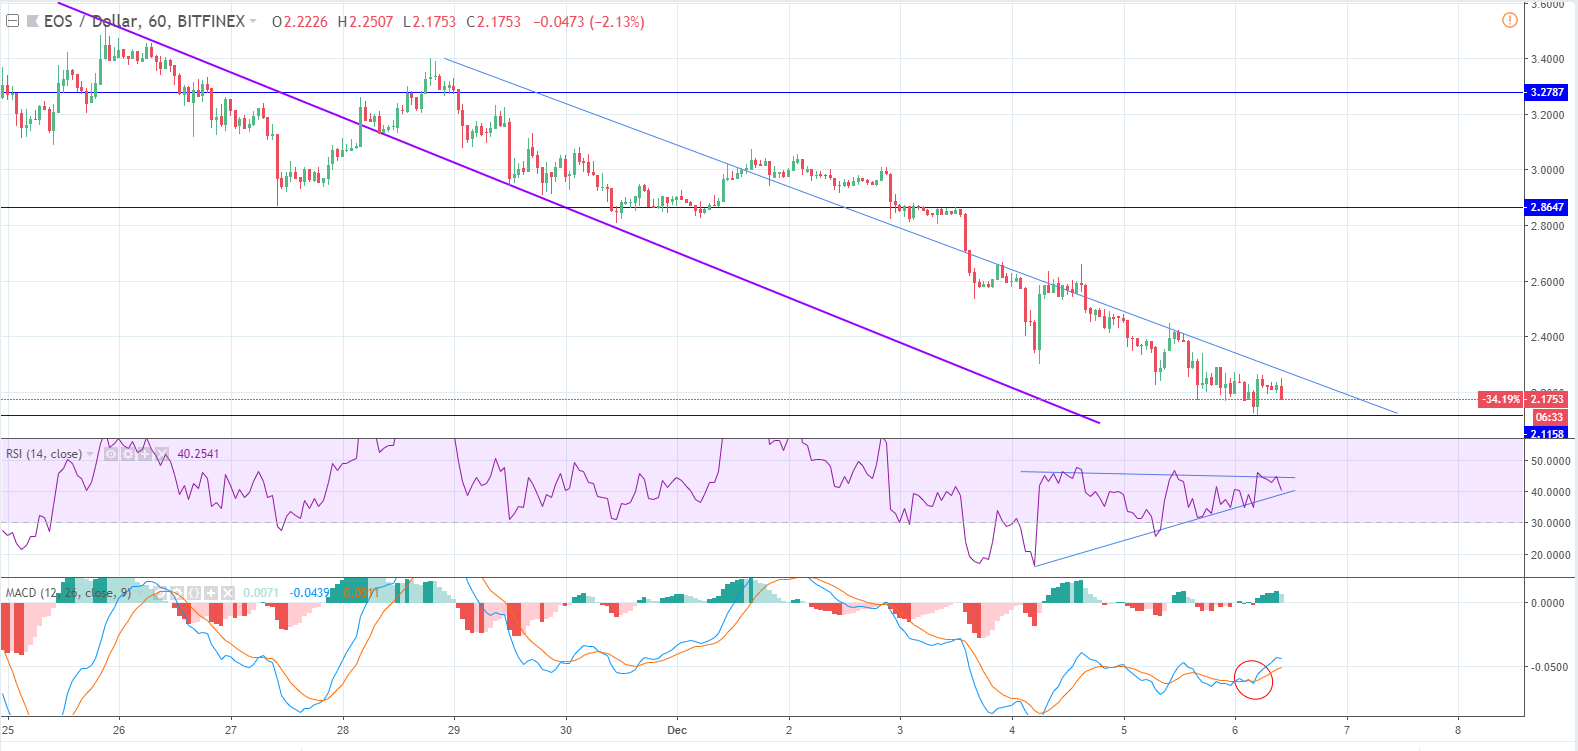
Since last Thursday when the price of EOS was at $3.3 at the opening measured to the current levels on which the cryptocurrency is being traded at $2.175, we have seen a 34.21% drop in price over the course of the last seven days.
Looking at the hourly chart, you can see that the price action is in a very clear downtrend dating from 7th of November. The current minor down move started after the price broke out the purple line, which was the prior minor downtrend resistance. However it failed to break the resistance at the $3.278 horizontal level where it got rejected and selling continued.
Today the price reached $2.115, which is the lowest price since the start of the year. The level is semi significant, and that is why considering the momentum behind the sell-off it wouldn’t surprise me if it breaks on the next interaction. But I don’t believe that it will. As you can see the price only quickly interacted with the level, which would be seen as a wick on a higher time frame so the price is looking like its holding there around the current levels.
RSI has formed an ascending triangle, which indicates a buying sentiment as buyers are putting pressure on the same resistance level from a higher price point every time. Currently, the RSI is at 40%, which is slightly below mid-range. MACD is also indicating bullish sentiment as the faster yellow MA crossed the slow blue one from the upside and are currently in an upward trajectory.
I believe that the price is heading upwards from here and will break out the blue descending line, which is the resistance from the current minor downtrend and potentially recover to around $2.86 in one go, which would be an increase of 31%.