


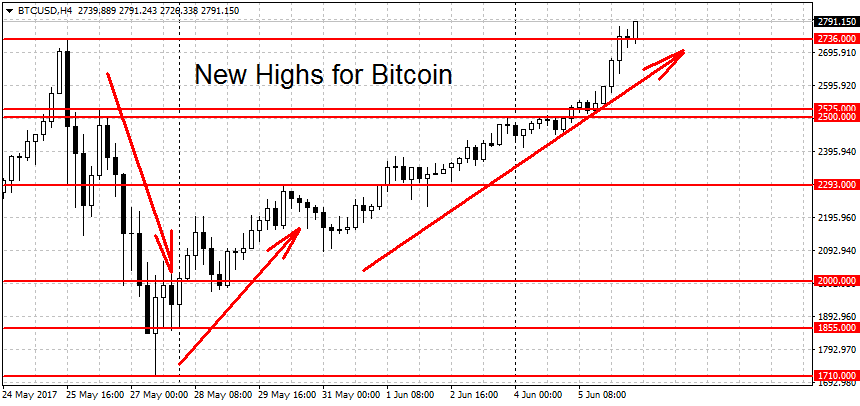
New Highs for Bitcoin
FXOpen
Another green week for bitcoin. The leading crypto-currency managed to break the previous all-time high today to hit $2791 on FXOpen. Litecoin managed to get out of its downtrend after being helped by the BTC recovery.
New Highs for Bitcoin
New highs were reached today at $2791 dollars per coin. This is a gain of $571 or over 25 percent since our last update. It seems that BTC gains are getting close parabolic again, which means either even bigger gains or another sharp correction. As a reminder, the last one took down BTC/USD by $1,026 from the highs.
Fundamentally there isn’t much to support the new higher valuation. The network remains bogged down with high fees and disagreement between developers and miners on how to solve the problem. But a bubble lifts all boats and that seems to be the case here. The total crypto market cap has now reached 102.9 billion, with bitcoin occupying 47.5 billion of the total, or around 46 percent.
Technically, the daily trend remains up, to end it the bears need to push prices below the $1,855 level. Due to the fact that we’re near all-time highs, there are no previous resistance levels on the upside. Below current prices, we have support at the $2,091 swing low followed by the $2,000 round figure. A move below the $1,700 level is needed for a new downtrend. On the long-term charts (weekly and monthly) BTC/USD remains in bullish mode.
Litecoin Back in Range
Litecoin prices are back in range after a large 100% rally from the $15 lows on May 27th. Yesterday we hit a high of $30.59 on FXOpen. The previous downtrend is now over and LTC/USD is back in range mode.
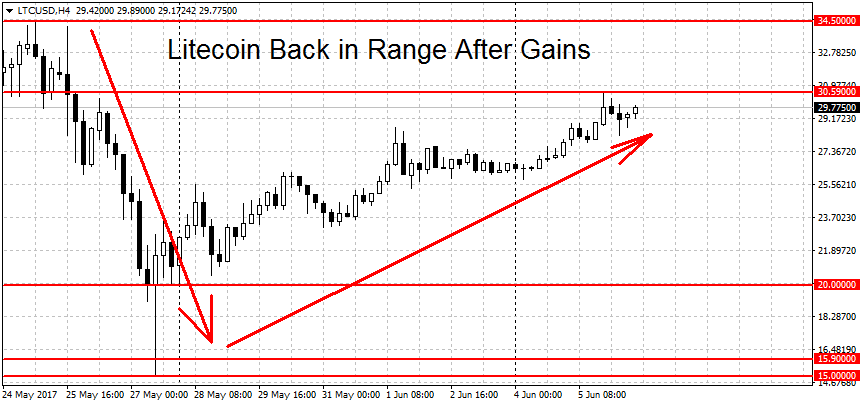
A new cryptocurrency trading rally requires a breakout above the $34.50 level while a new downtrend could commence below $15 dollars per coin. For now, we are in ‘wait and see’ mode here. Weak resistance on the way up can be found at $30.59, followed by a stronger level at $34.50 and even stronger resistance area around the $36.25 all-time high. A breakout above here could lead to extended LTC gains.
On the way down we find support at the $20 round figure. Below here there’s the latest major swing low at $15 dollars, followed by a support area stretching from the $12.55 swing highs to the $13.33 swing lows. A clearing of this area could set us up for an attack on the $10 round level. On the longer-term charts (both weekly and monthly) Litecoin remains in an uptrend.
FXOpen offers the world's most popular cryptocurrency CFDs*, including Bitcoin and Ethereum. Floating spreads, 1:2 leverage — at your service (additional fees may apply). Open your trading account now or learn more about crypto CFD trading with FXOpen.
*Important: At FXOpen UK, Cryptocurrency trading via CFDs is only available to our Professional clients. They are not available for trading by Retail clients. To find out more information about how this may affect you, please get in touch with our team.
This article represents the opinion of the Companies operating under the FXOpen brand only. It is not to be construed as an offer, solicitation, or recommendation with respect to products and services provided by the Companies operating under the FXOpen brand, nor is it to be considered financial advice.
Stay ahead of the market!
Subscribe now to our mailing list and receive the latest market news and insights delivered directly to your inbox.


Latest articles

Weekly Market Insights with Gary Thomson: The Week of Central Banks and Earnings
In this video, we’ll explore the key economic events and market trends, shaping the financial landscape. Get ready for insights into financial markets to help you navigate the week ahead. Let’s dive in!
In this episode of Market

Intel at a Crossroads: Earnings Beat Meets Technical Resistance
Intel has just delivered its strongest quarter in over fifteen years, and the market reaction says it all. Q2 2026 revenue surged 25% year-over-year to $16.1 billion, crushing the consensus estimate of $14.42 billion, while adjusted EPS of

Tesla: Complex Range Structure Breaks Down Following Quarterly Earnings
Tesla released its Q2 2026 results after the market closed on 22 July. Revenue increased 26% year-on-year to $28.24 billion, while vehicle deliveries reached a record 480,126 units. However, operating margin fell sharply to 1.4%, down from