


FXOpen
The Kiwi sustains the bullish momentum against the Japanese yen on Wednesday, following the release of New Zealand’s unemployment data.
The aftermath of BOJ’s unexpected increase in quantitative easing still prevails with the 7-year decrease in the price of Japanese yen that consequently resulted in a huge bullish momentum in the price of NZD/JPY.
Technical Analysis
As of this writing, the pair is being traded around 88.87. The pair opened the Asian session at 88.71, breaching the September high and creating the intra-day high at 89.25.
On the upside, the pair may face a hurdle around 89.56 – 89.68, the high of July. Crossing this, the pair will move to the 90.00 milestone to print a new high for the ongoing year. On the downside, the pair will find the support around 87.70, the psychological number. Another major support lies around 87.100, the psychological number and confluence of 100-day and 50-Day SMA. It also acted as a support on various occasions in September.
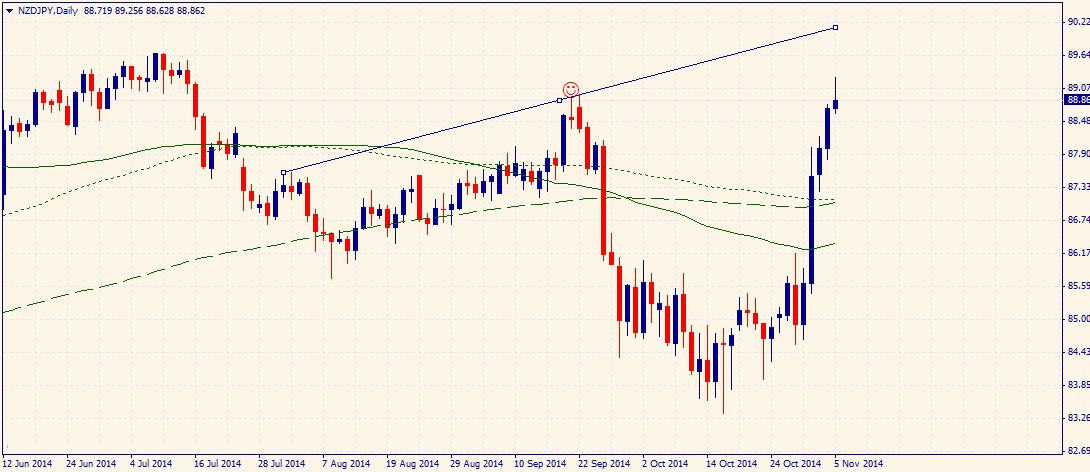
The bears are trying to recover and the market is getting ready for reversal as indicated by the ongoing formation of shooting star on the daily chart and formation of bearish engulfing candle on the 4-hour chart. The trend reversal will be valid only if the daily candle closes around 88.75. The overall bias is bullish because of higher highs and higher lows on the daily chart.
NZD Unemployment Rate
The NZ unemployment Rate remains at 5.4% for the third quarter in line with expectations of analysts. As released by the Statistics New Zealand, the unemployment rate is considered as a key yardstick for the economy. Thus a higher reading is considered bearish for the Kiwi.
JPY Monetary Base
The monetary base for this October increased to 36.9% as compared to the 35.3% of the month before. As a major indicator of inflation, an increased supply of money is considered bullish for the Yen. Thus the high reading proved bullish for the Japanese yen and forcing down the price of NZD/JPY.
Trade Idea
Considering the technical and fundamental outlook, it is better to stay at side lines. Going long is no more feasible as the market is going in indecision mode. Selling the pair around current levels can be a good strategy if the daily candle closes below 88.70-88.75.
Trade over 50 forex markets 24 hours a day with FXOpen. Take advantage of low commissions, deep liquidity, and spreads from 0.0 pips (additional fees may apply). Open your FXOpen account now or learn more about trading forex with FXOpen.
This article represents the opinion of the Companies operating under the FXOpen brand only. It is not to be construed as an offer, solicitation, or recommendation with respect to products and services provided by the Companies operating under the FXOpen brand, nor is it to be considered financial advice.
Stay ahead of the market!
Subscribe now to our mailing list and receive the latest market news and insights delivered directly to your inbox.


Latest articles

Dollar Index (DXY) Hits Yearly High
Today, the dollar index rose above last week’s peak around the 99.68 level, setting a new high for 2026. This movement is supported by a tense fundamental backdrop:
→ Inflationary pressures from rising oil prices. Markets may be pricing

WTI Oil Price Rises Above $100
Another shocking Monday for the energy market. Last week’s start was remembered for a bullish gap of more than 10% (which was later followed by a pullback), but today’s market open proved even more volatile (as reflected by

Market Analysis: AUD/USD and NZD/USD Struggle as Market Jitters Shake Risk Sentiment
AUD/USD failed to stay in a positive zone and declined below 0.7000. NZD/USD is also moving lower and might extend losses below 0.5850.
Important Takeaways for AUD/USD and NZD/USD Analysis Today
· The Aussie Dollar