


FXOpen

Alphabet Inc. (GOOGL) shares closed below $150 yesterday, a level last seen in late March this year.
According to Barron’s, the stock is under pressure due to ongoing litigation with the US Department of Justice (DOJ), which:
→ claims Google holds a monopoly over software used for buying and selling digital ads, alleging the company uses its size to stifle competition.
→ argues that Google employed unlawful methods to block rival ad technologies, forcing advertisers and publishers to use its systems.
The DOJ suggests that Google should divest a product called Ad Manager.
Google, however, maintains that the digital advertising market is more competitive than ever, and the government's arguments don’t reflect the current state of affairs. The company asserts that its case involves website ads, while most of the advertising industry has shifted to apps, social media, and Smart TVs.
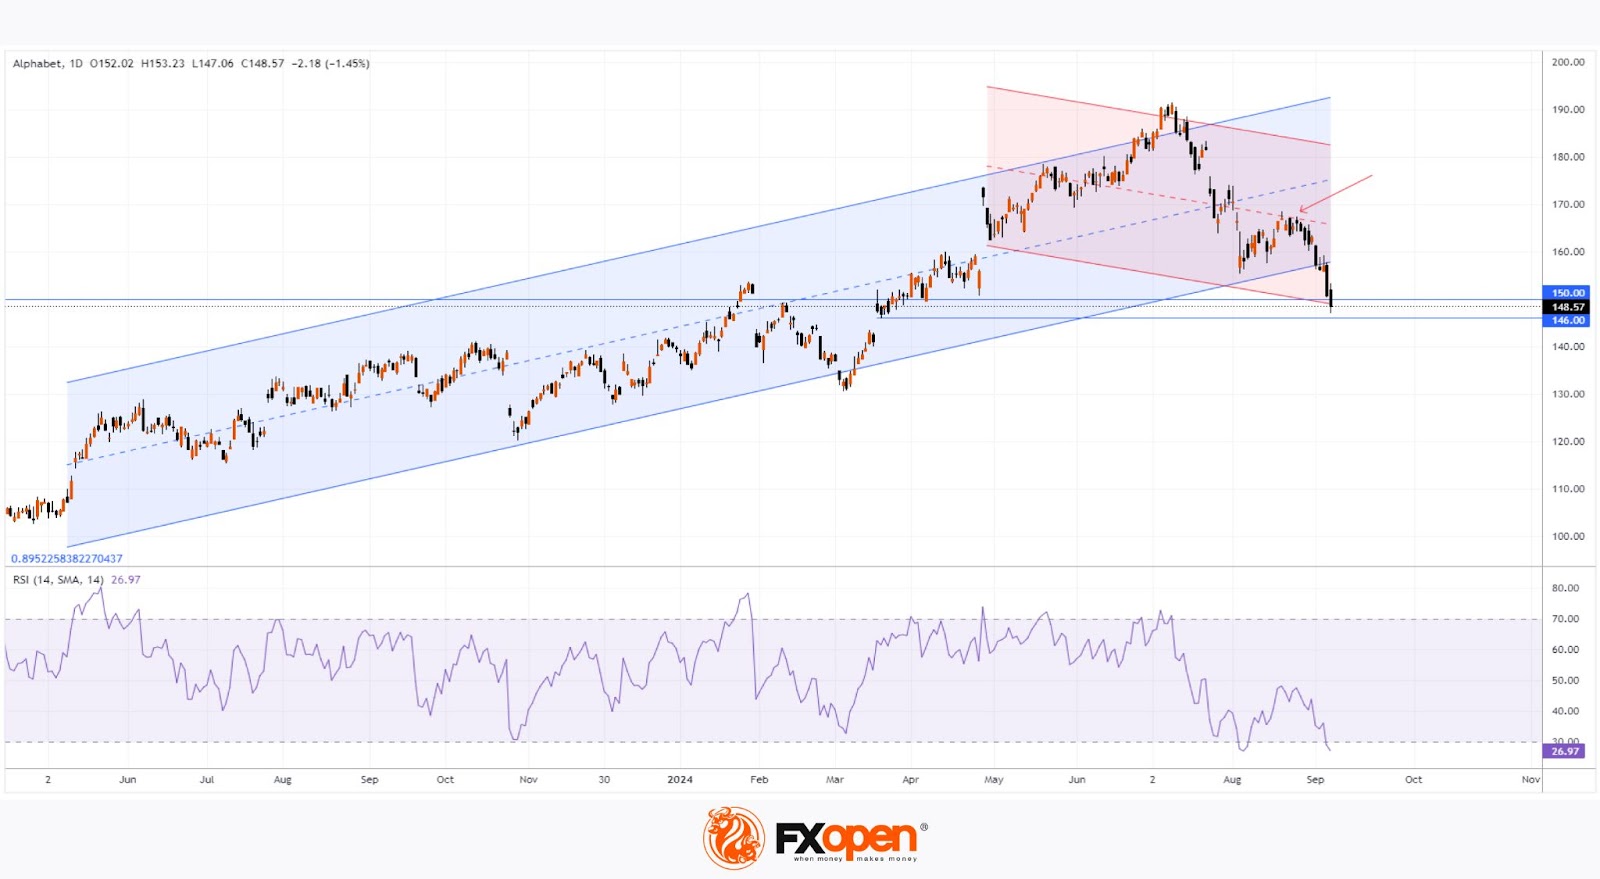
As the case proceeds, it may act as a bearish factor for Alphabet’s stock price. Technical analysis of GOOGL shares today shows:
→ Since May last year, long-term price movement has formed an upward linear regression channel (blue), with the current price dropping below the channel’s lower boundary and the RSI indicator entering the oversold zone for the second time this year.
→ Short-term price movement since late April 2024 forms a downward linear regression channel (red), with the median line acting as resistance (indicated by the red arrow) – a bearish signal.
Potential support levels for GOOGL shares include:
→ The psychological $150 level.
→ A bullish gap zone around $146.
→ The lower boundary of the red channel.
Given this, it’s reasonable to expect GOOGL’s stock price may recover in the coming days from these support levels, especially if there are signs the trial could conclude in Alphabet Inc.'s favour.
Buy and sell stocks of the world's biggest publicly-listed companies with CFDs on FXOpen’s trading platform. Open your FXOpen account now or learn more about trading share CFDs with FXOpen.
This article represents the opinion of the Companies operating under the FXOpen brand only. It is not to be construed as an offer, solicitation, or recommendation with respect to products and services provided by the Companies operating under the FXOpen brand, nor is it to be considered financial advice.
Stay ahead of the market!
Subscribe now to our mailing list and receive the latest market news and insights delivered directly to your inbox.


Latest articles

Weak Data Weigh on the Dollar: Market Awaits Trend Confirmation
The US dollar is retreating from recent highs, moving into a moderate correction after a prolonged period of gains. Pressure on the currency is building amid weaker-than-expected macroeconomic data, while market participants adopt a wait-and-see approach ahead of key labour

Market Analysis: EUR/USD Aims Recovery While USD/JPY Gives Back Recent Gains
EUR/USD is recovering losses from 1.1450. USD/JPY is correcting gains from 160.50 and might decline further below 158.00.
Important Takeaways for EUR/USD and USD/JPY Analysis Today
· The Euro struggled to stay in a

European Currencies Decline: Pound Hits New Lows, Euro Under Pressure
European currencies continue to weaken against the US dollar amid rising geopolitical tensions and increased demand for safe-haven and liquid assets. Market participants are reducing exposure to riskier instruments, putting pressure on both the euro and the pound. Additional support