


FXOpen

On 24th July, we noted in our analysis of the Alphabet Inc (GOOGL) price chart:
→ The share price had fallen despite the report's results surpassing analysts' expectations;
→ The upward momentum in the price chart was losing strength.
Since that publication, the Alphabet Inc (GOOGL) share price has dropped by 5%. While the sharp decline in stock markets on 5th August significantly impacted it, it's worth noting that since the previous Monday, the share price has been recovering more poorly than the index.
Bearish sentiment is being driven by:
→ A delay in showcasing the capabilities of the Gemini AI assistant at the “Made by Google” event;
→ Speculation about a potential breakup of Google under US antitrust laws. According to Benzinga, the US Department of Justice (DOJ) is considering this possibility.
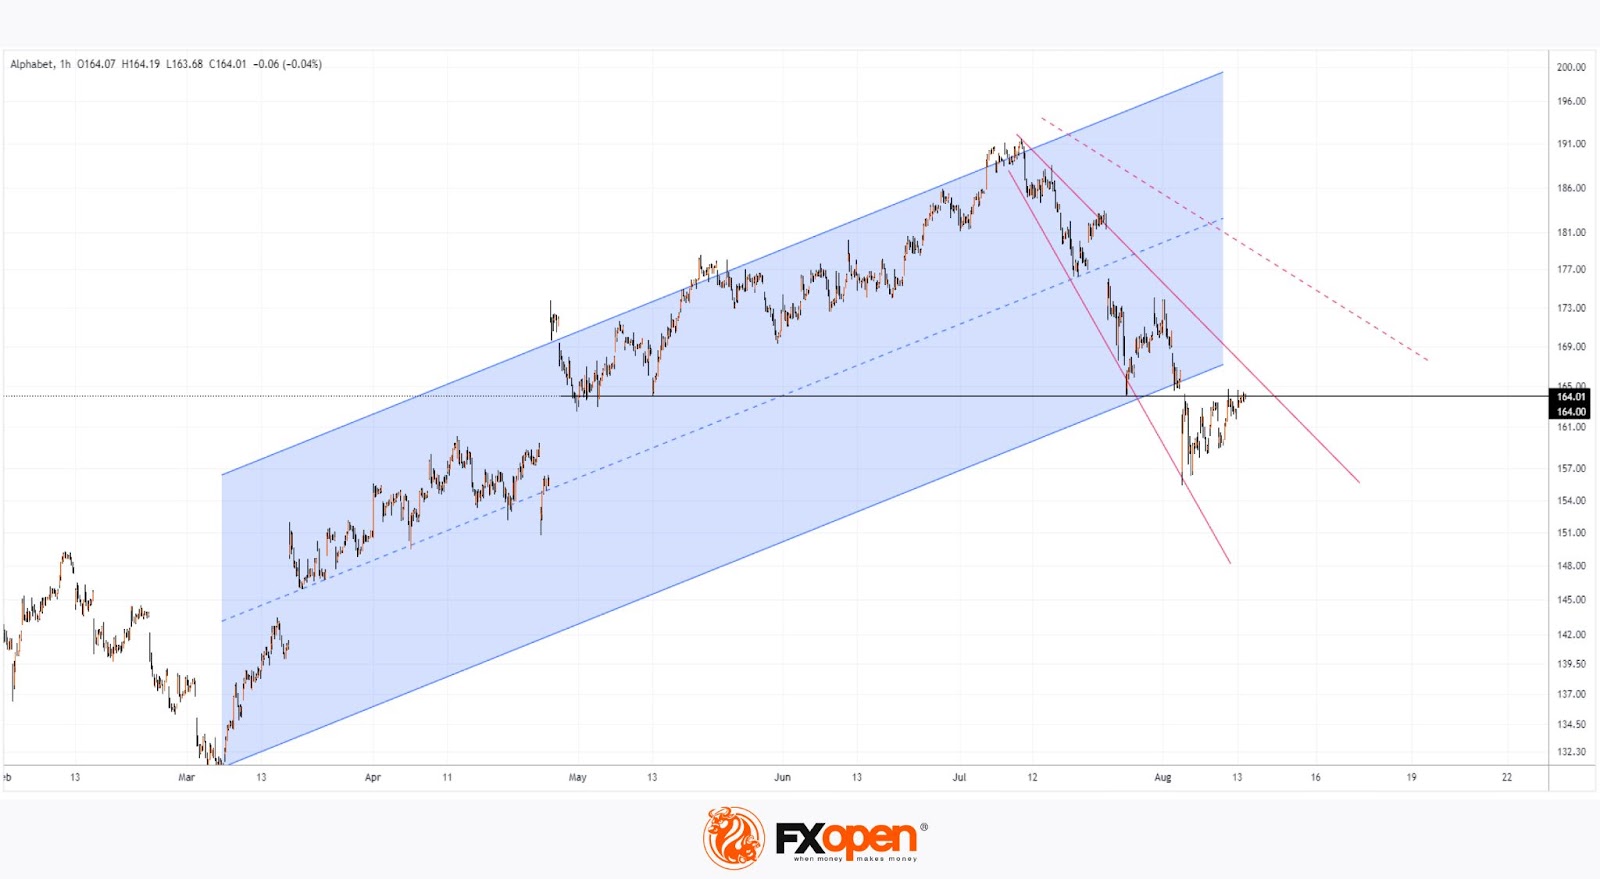
Technical analysis of the Alphabet Inc (GOOGL) stock chart shows that:
→ The price has dropped below the blue ascending channel;
→ The price has broken below the $164 level, which had acted as support since the gap formation in late April. This week, it is showing signs of resistance;
→ Price action in early August has formed the contours of an expanding fan pattern (shown in red).
If bulls manage to break through the $164 level, they may encounter resistance from the next fan line (shown as a dashed line).
Meanwhile, 37 Wall Street analysts surveyed by TipRanks have positive forecasts:
→ 30 analysts recommend buying Alphabet Inc (GOOGL) shares, with none recommending a sell;
→ The price target for Alphabet Inc (GOOGL) is $204.74 over the next 12 months (+24.72% from yesterday’s close).
Buy and sell stocks of the world's biggest publicly-listed companies with CFDs on FXOpen’s trading platform. Open your FXOpen account now or learn more about trading share CFDs with FXOpen.
This article represents the opinion of the Companies operating under the FXOpen brand only. It is not to be construed as an offer, solicitation, or recommendation with respect to products and services provided by the Companies operating under the FXOpen brand, nor is it to be considered financial advice.
Stay ahead of the market!
Subscribe now to our mailing list and receive the latest market news and insights delivered directly to your inbox.


Latest articles

European Currencies Decline: Pound Hits New Lows, Euro Under Pressure
European currencies continue to weaken against the US dollar amid rising geopolitical tensions and increased demand for safe-haven and liquid assets. Market participants are reducing exposure to riskier instruments, putting pressure on both the euro and the pound. Additional support

Market Analysis: GBP/USD Dips Further As EUR/GBP Regains Traction
GBP/USD failed to climb above 1.3500 and corrected some gains. EUR/GBP started a decent increase and might aim for more gains above 0.8700.
Important Takeaways for GBP/USD and EUR/GBP Analysis Today
· The British Pound
