


FXOpen

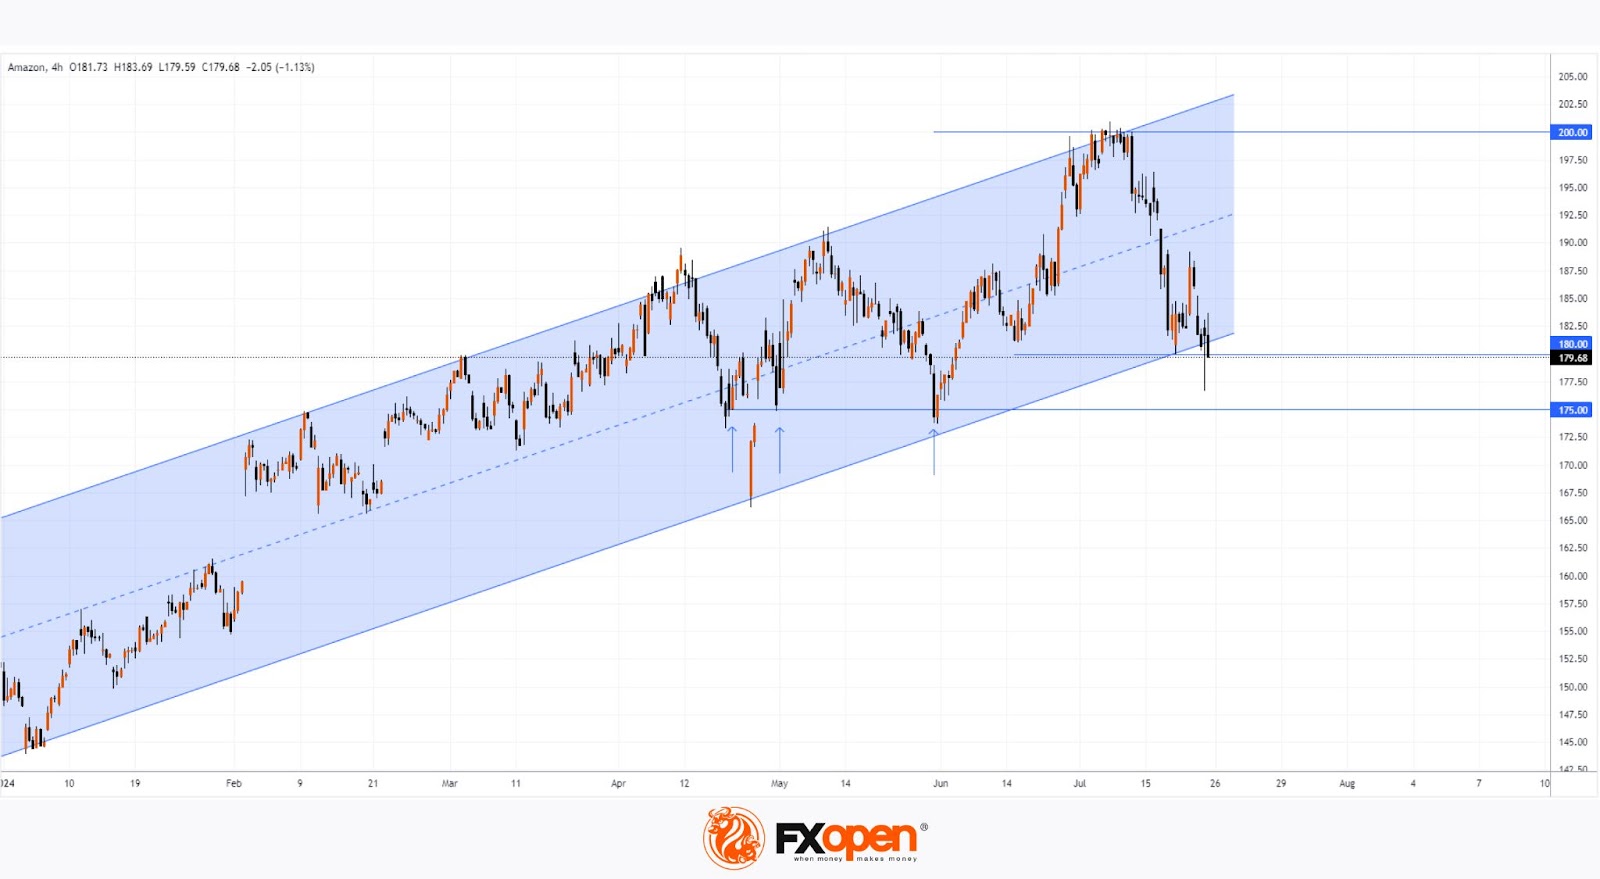
As shown in the AMZN chart, the stock price dropped below:
→ the psychological level of $180;
→ the mid-June interim low.
The last time AMZN traded below $180 was in early June.
Thus, AMZN has faced sell-offs, similar to other tech stocks whose charts we've published this week. A widely mentioned reason for the sell-offs is investor rotation, moving capital from overbought tech stocks to shares in other sectors.
Will AMZN's price drop further?
Fundamentally, bulls might find hope in speculation that:
→ the company might start paying dividends. Rumours suggest the company has accumulated $100 billion in cash;
→ Amazon in Austin, Texas, is developing its own AI chip to compete with Nvidia.
Technical analysis of the AMZN stock chart also provides reasons to expect a recovery (at least in the short term):
→ The price is near the lower boundary of an ascending channel that has been in place in 2024, which may act as support.
→ The false breach of the $180 psychological level could also support the price by altering the supply-demand balance.
→ Below yesterday's low is the $175 level, which has repeatedly shown support in 2024, as indicated by arrows.
A bounce from these supports could provide valuable insights into the bulls' aggressiveness.
Meanwhile, forecasts are optimistic. According to TipRanks, all 44 Wall Street analysts recommend buying AMZN stock, with an average price target of $224.60 (nearly +25% from current levels) within 12 months, surpassing the current high around the psychological level of $200.
Note that analysts' opinions may change after the Q2 earnings report, scheduled for August 1.
Buy and sell stocks of the world's biggest publicly-listed companies with CFDs on FXOpen’s trading platform. Open your FXOpen account now or learn more about trading share CFDs with FXOpen.
This article represents the opinion of the Companies operating under the FXOpen brand only. It is not to be construed as an offer, solicitation, or recommendation with respect to products and services provided by the Companies operating under the FXOpen brand, nor is it to be considered financial advice.
Stay ahead of the market!
Subscribe now to our mailing list and receive the latest market news and insights delivered directly to your inbox.


Latest articles

Market Analysis: GBP/USD Dips Further As EUR/GBP Regains Traction
GBP/USD failed to climb above 1.3500 and corrected some gains. EUR/GBP started a decent increase and might aim for more gains above 0.8700.
Important Takeaways for GBP/USD and EUR/GBP Analysis Today
· The British Pound


Market Insights with Gary Thomson: Oil, US Retail Sales & NFP in Focus
In this video, we’ll explore the key economic events and market trends, shaping the financial landscape. Get ready for insights into financial markets to help you navigate the week ahead. Let’s dive in!
In this episode of Market