


Analysis of MU Shares Following Earnings Report
FXOpen

Memory chip manufacturer Micron Technology (MU) published a positive financial report for Q4 of fiscal year 2025 on 23 September:
→ Q4 Revenue: Actual = $11.32 billion, up 46% compared with the same period last year.
→ Adjusted Earnings Per Share (EPS): Actual = $3.03 (analysts’ expectations = $2.87).
The main driver behind these strong results was heightened demand for high-performance memory needed for data centres and AI model training. Micron also published an optimistic outlook, forecasting revenue of between $12.2 billion and $12.8 billion in the next quarter.
Despite strong results and guidance, the share price reaction in the first week after publication has been moderate. Trading volumes were significantly above average, yet the price did not rise. Why?
1 → It is worth noting that Micron shares have nearly doubled in value since the start of 2025, which may indicate “bull fatigue.”
2 → A significant portion of the positive expectations tied to the AI boom is already priced into the current valuation.
Technical analysis shows more bearish signals.
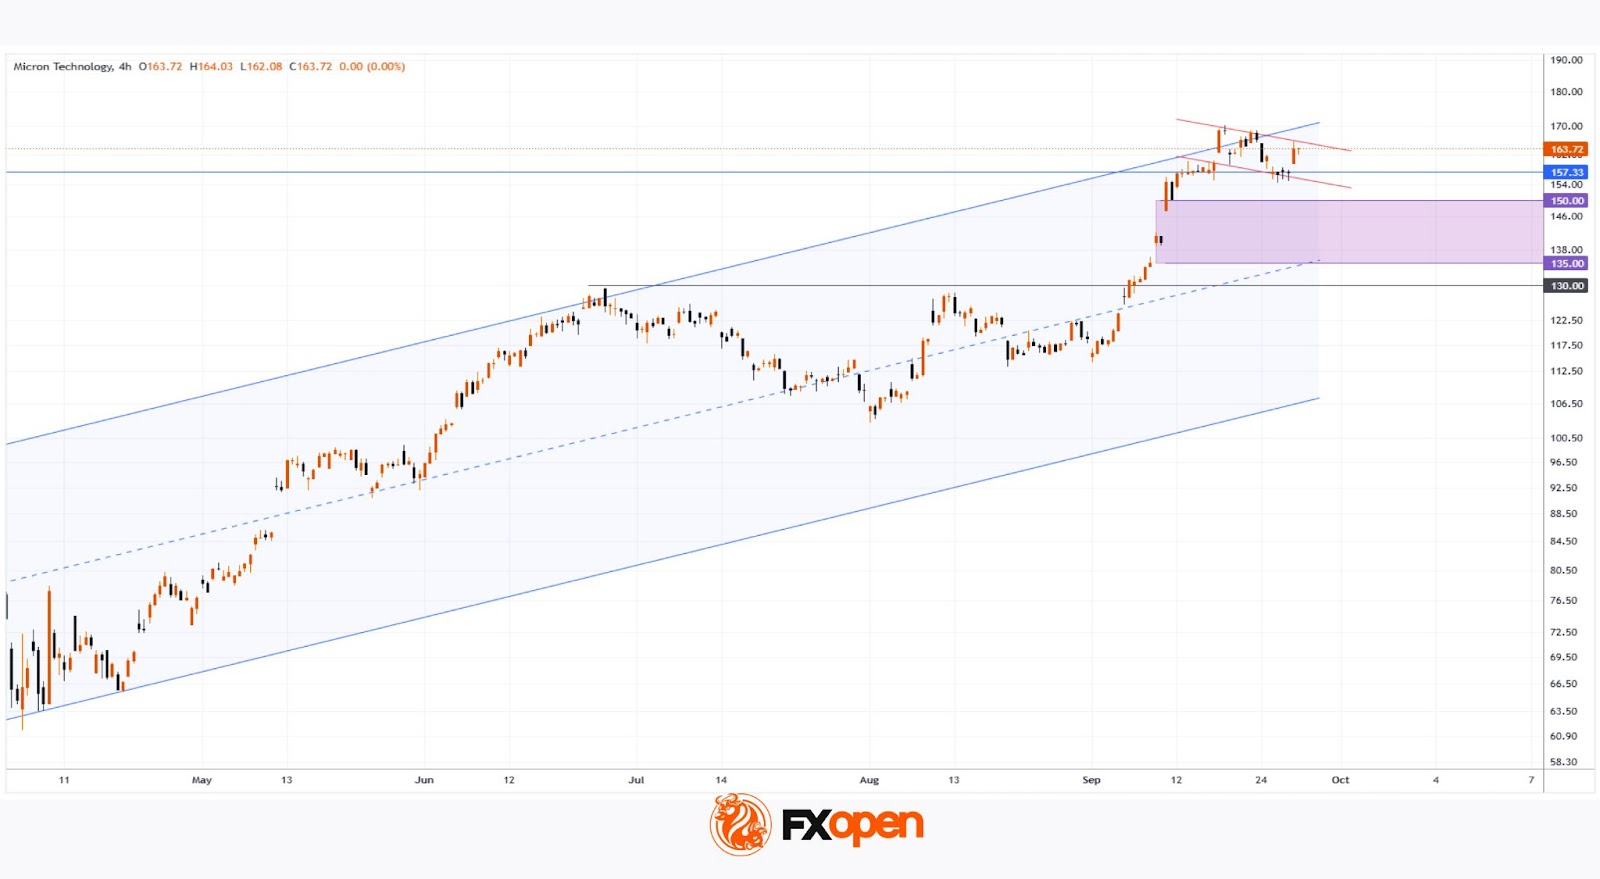
Technical Analysis of MU Shares
Since early April, Micron shares have shown staggering growth of approximately 150%, with:
→ Price fluctuations forming an ascending channel (shown in blue). After breaking through the key resistance level at $130 in early September, the price rose towards the upper boundary of the channel, which now acts as resistance.
→ During this rise, the price exceeded the previous all-time high; however, further progress has clearly slowed. It is possible that the news of the record high, combined with a strong earnings report, created a buying frenzy that allowed large shareholders to take profits, thereby placing pressure on the price.
From a bullish perspective, the chart shows a correction pattern in the form of a “bull flag” (marked in red), suggesting a potential breakout and continuation of growth.
However, given the above, there are grounds to expect a deeper correction — for example, towards the median of the current channel, supported by a wide $135–150 zone (marked in purple), where the price previously rose particularly quickly, highlighting an imbalance in favour of buyers.
Buy and sell stocks of the world's biggest publicly-listed companies with CFDs on FXOpen’s trading platform. Open your FXOpen account now or learn more about trading share CFDs with FXOpen.
This article represents the opinion of the Companies operating under the FXOpen brand only. It is not to be construed as an offer, solicitation, or recommendation with respect to products and services provided by the Companies operating under the FXOpen brand, nor is it to be considered financial advice.
Stay ahead of the market!
Subscribe now to our mailing list and receive the latest market news and insights delivered directly to your inbox.


Latest articles

CAD/JPY: The Yen's Most Historic Move in 30 Years Meets a Fragile Support
Two central banks are heading in genuinely opposite directions this week, and the tension is unmistakable. The Bank of Canada held rates steady at 2.25% on September 2, with a mildly hawkish tilt as policymakers acknowledged a broadening economic

USD/JPY and USD/CAD Await Key Fed Decision
The US dollar is consolidating against the yen and Canadian dollar ahead of the key event of the week — the Federal Reserve meeting. The Fed is widely expected to raise its policy rate by 25 basis points to a range

UnitedHealth: Fundamentals Are Healing, Now the Chart Must Agree
UnitedHealth finds itself in a genuinely split narrative right now, trading near $388, down about 15.9% from its 52-week high, even as the fundamental picture keeps improving. Q2 earnings beat expectations, with revenue of $112.03 billion, and the