


Analysis of the Nvidia (NVDA) Share Chart
FXOpen

Last week, we published a post titled “Ahead of Nvidia’s (NVDA) Earnings: How the Price Could Move”, in which we:
→ Drew an ascending channel (shown in blue);
→ Suggested that market participants’ overly high expectations would likely not be met when earnings were released, leading to a decline in NVDA’s price towards the lower boundary of the ascending channel, where support lies at $165.
In reality, the earnings report turned out to be very strong:
→ Gross revenue: actual = $57bn, forecast = ~$54.9bn.
→ Earnings per share (EPS): actual = $1.30, forecast = $1.26 (previous quarter = $1.05).
The surge in price with a bullish gap towards point A reflected the initial reaction to the strong figures, but the share price then began to fall (reaching a two-month low), thereby confirming our expectations.
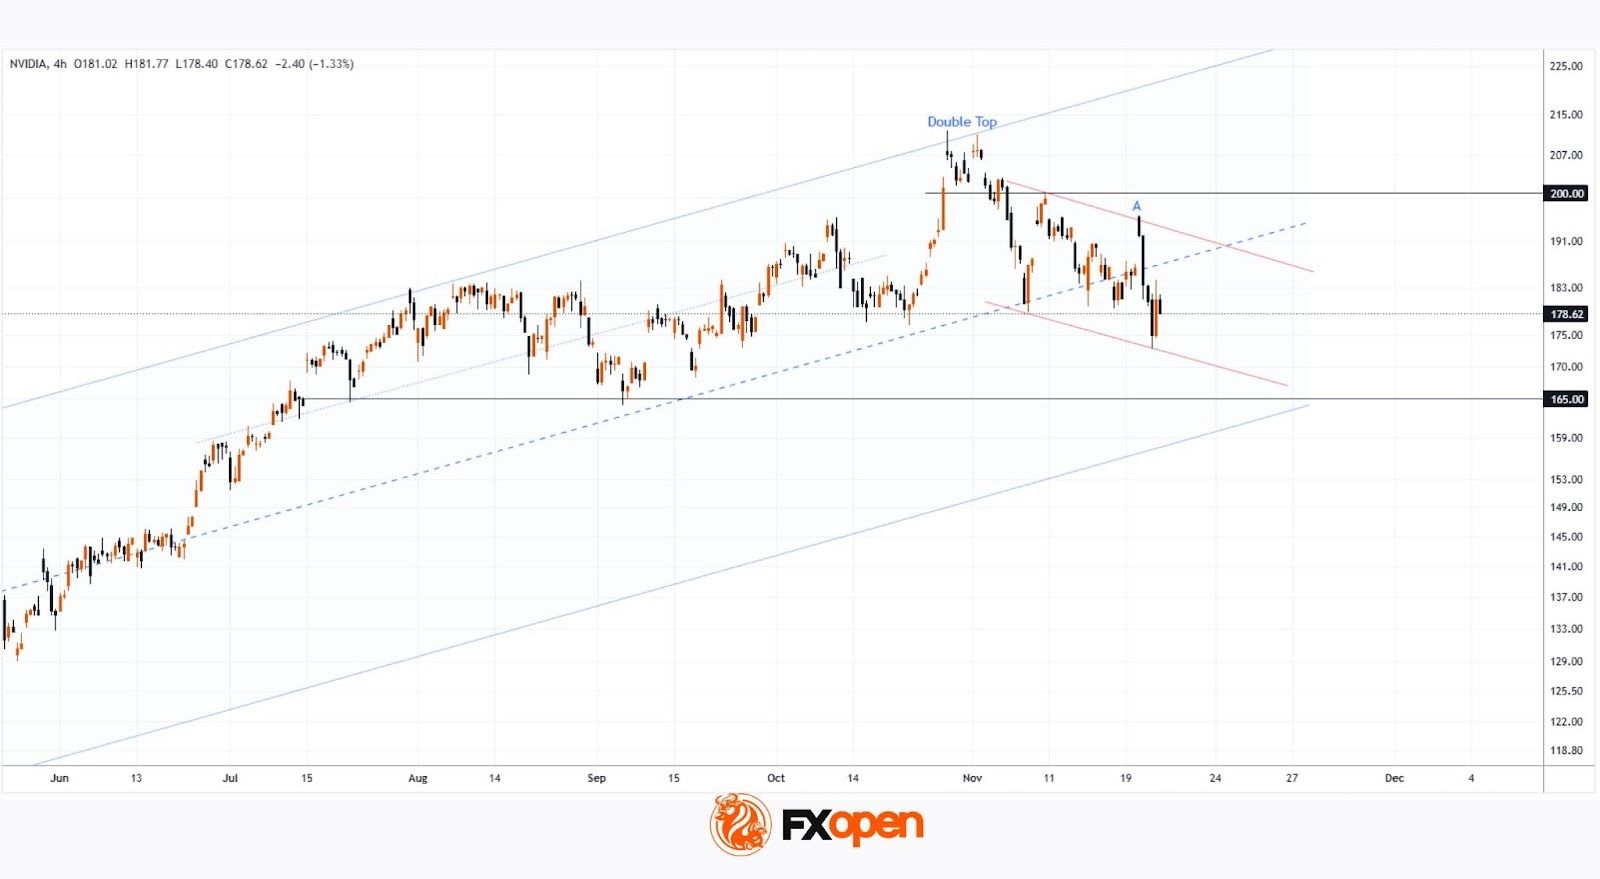
Technical Analysis of the Nvidia (NVDA) Chart
An analysis of NVDA’s price action suggests that the current situation can be viewed as a correction (shown with red lines), forming within an expanded ascending channel.
If NVDA’s share price declines towards the $165 level, where the lower boundary of the channel lies, this could encourage the bulls to attempt to resume the 2025 uptrend and mount a new push towards the psychological $200 mark.
Buy and sell stocks of the world's biggest publicly-listed companies with CFDs on FXOpen’s trading platform. Open your FXOpen account now or learn more about trading share CFDs with FXOpen.
This article represents the opinion of the Companies operating under the FXOpen brand only. It is not to be construed as an offer, solicitation, or recommendation with respect to products and services provided by the Companies operating under the FXOpen brand, nor is it to be considered financial advice.
Stay ahead of the market!
Subscribe now to our mailing list and receive the latest market news and insights delivered directly to your inbox.


Latest articles


Market Repricing of Risk as Gold Loses Safe-Haven Demand
Geopolitical tensions in the Middle East had remained the primary macro driver for the gold market over recent weeks; however, on 8 April the situation shifted sharply as the United States and Iran agreed to a temporary two-week ceasefire, including

Commodity Currencies on the Rise: Market Focus Shifts to US and Canadian Data
Commodity-linked currencies continue to strengthen, while the US dollar remains under pressure amid easing geopolitical tensions and a shift in investor preference towards riskier assets. Reports of a temporary ceasefire between the US and Iran have helped stabilise sentiment and