


Analysis of USD/JPY: Yen Strengthens by 5.5% Against US Dollar in 2 Weeks
FXOpen

On Thursday, 11 July, the USD/JPY exchange rate was above 161, and today it is below 153.
According to Reuters, this could be attributed to effective intervention by the Bank of Japan.
While intervention was anticipated when the yen weakened to extreme levels not seen since 1983, Tokyo authorities were cryptic in their comments, maintaining uncertainty, making it harder for investors to predict when and how they might intervene.
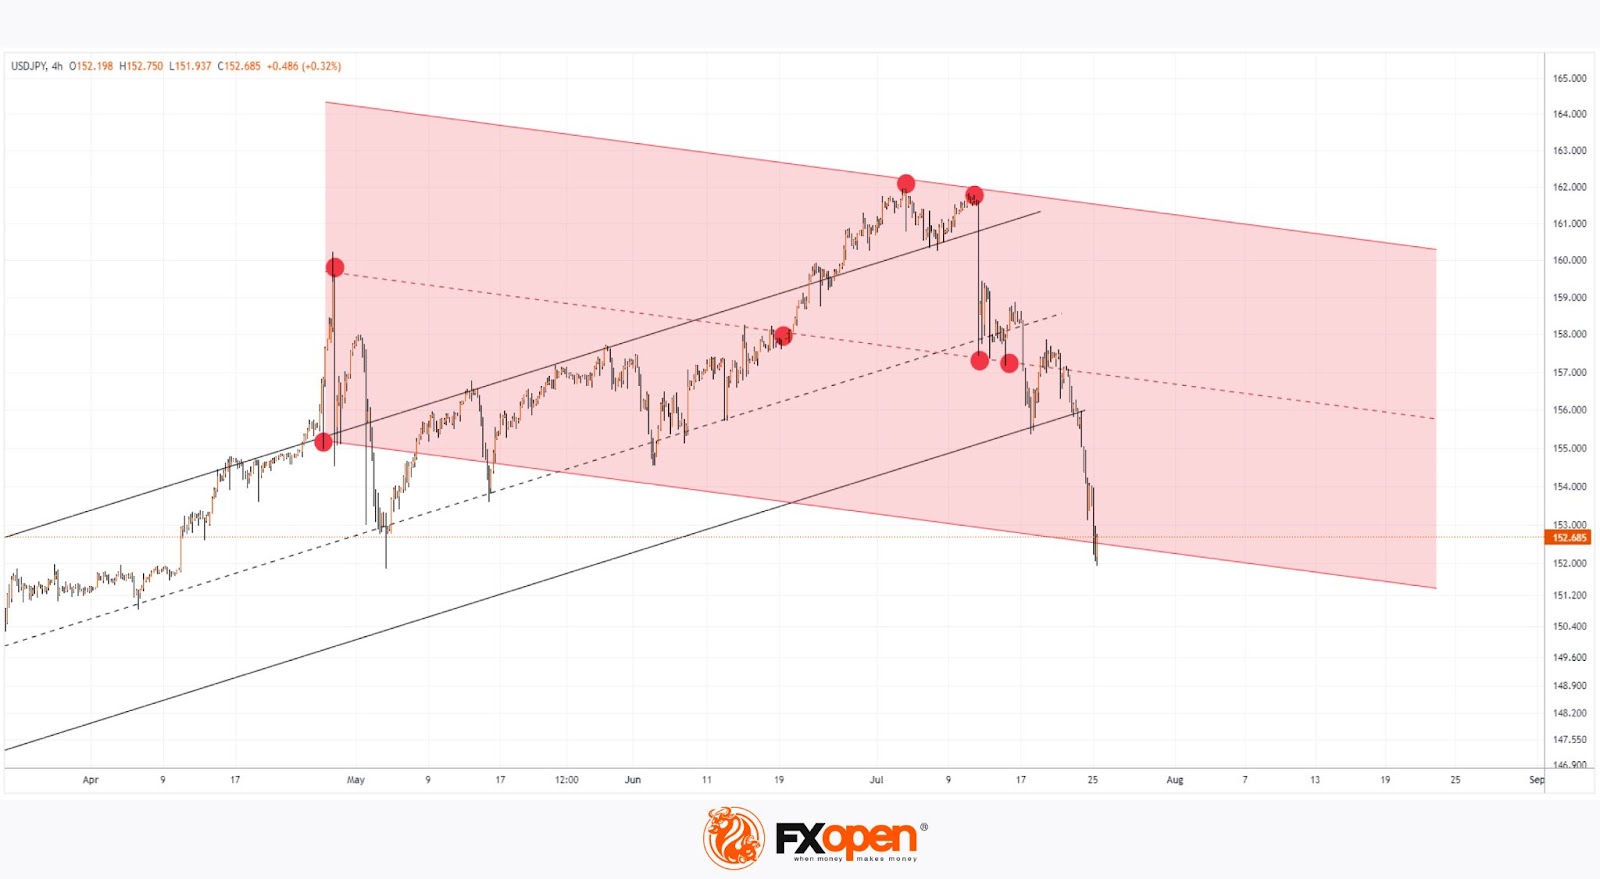
As indicated by today's USD/JPY chart:
→ The ascending trend channel (shown in black) that has been in place since 2023 is losing its relevance.
→ Red circles indicate pivotal points where significant price action occurred, helping to define the contours for a descending channel (shown in red).
→ The USD/JPY rate is near the lower boundary of the red channel. According to technical analysis, this boundary tends to act as support for the price – a bullish argument suggesting that the decline might slow down here.
Whether there will be a rebound from the lower line of the descending channel or the bears will manage to break through the 152 level (where the price found support in May) will largely depend on next week’s news: Tuesday will bring reports on inflation and unemployment in Japan, and Wednesday will see statements from the Bank of Japan regarding the interest rate.
Trade over 50 forex markets 24 hours a day with FXOpen. Take advantage of low commissions, deep liquidity, and spreads from 0.0 pips (additional fees may apply). Open your FXOpen account now or learn more about trading forex with FXOpen.
This article represents the opinion of the Companies operating under the FXOpen brand only. It is not to be construed as an offer, solicitation, or recommendation with respect to products and services provided by the Companies operating under the FXOpen brand, nor is it to be considered financial advice.
Stay ahead of the market!
Subscribe now to our mailing list and receive the latest market news and insights delivered directly to your inbox.


Latest articles

Bitcoin: Futures Momentum vs Spot Market Reality
Rising oil prices amid risks to shipping through the Strait of Hormuz have strengthened global inflation expectations. According to the Pentagon, clearing the strait could take at least six months, sustaining uncertainty in commodity markets and weighing on risk assets

EUR/USD and EUR/CAD Continue Correction Ahead of Key Data
The euro remains under pressure, extending its corrective decline following the previous impulsive rally. Market participants are taking profits and trimming positions ahead of key macroeconomic releases, reducing demand for the single currency and keeping both pairs near important levels,

Opening Range Breakout (ORB) Strategy Explained
The Opening