


Analysis of XAU/USD: Gold Price Falls for 4 Consecutive Days
FXOpen

As shown on the XAU/USD chart, Monday, 22 July marked the fourth consecutive day of declining gold prices. The change from the historical peak reached on Wednesday is around -3.5%.
Bearish sentiment is driven by:
→ Market participants' assessment of prospects due to the change of the Democratic Party's presidential candidate in the US.
→ Caution in anticipation of economic news. On Thursday at 15:30 GMT+3, US GDP data will be released. On Friday at the same time, the Core PCE Price Index data will be published.
Market participants may also be influenced by the psychological level of $2500.
Can the Gold Price Fall Further?
Technical analysis of the XAU/USD chart provides valuable insights:
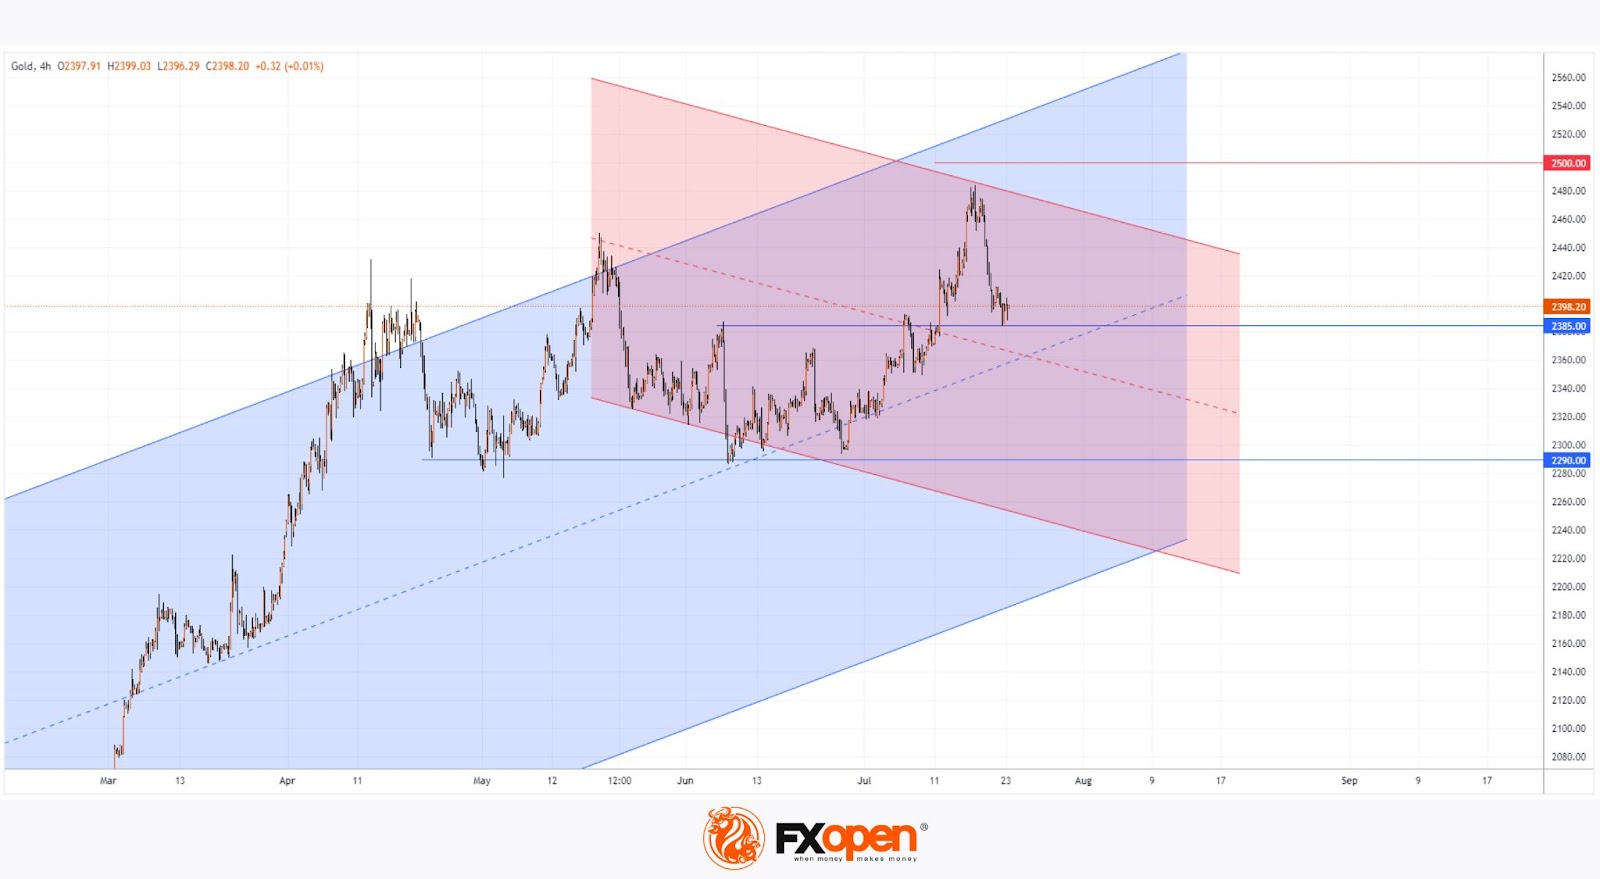
→ In June, the gold price was within the range of 2290-2385. The rise to July's peak corresponds to a target calculated by the range height: 2385 + (2385 - 2290) = 2480;
→ After reaching a record on 17 July, the price failed to hold above the May peak, which is a bearish sign;
→ The XAU/USD chart shows increasing support points for a descending channel (shown in red), which may form a corrective movement within a broader upward trend (shown in blue).
Bulls may take advantage of the gold price being near the support block of 2365-2385, which is formed by:
→ The former resistance at 2385;
→ The median lines of the blue and red channels.
However, if we see a weak rebound from this block, it may indicate that the gold price is indeed in a corrective phase.
Start trading commodity CFDs with tight spreads (additional fees may apply). Open your trading account now or learn more about trading commodity CFDs with FXOpen.
This article represents the opinion of the Companies operating under the FXOpen brand only. It is not to be construed as an offer, solicitation, or recommendation with respect to products and services provided by the Companies operating under the FXOpen brand, nor is it to be considered financial advice.
Stay ahead of the market!
Subscribe now to our mailing list and receive the latest market news and insights delivered directly to your inbox.


Latest articles

GBP/USD and EUR/GBP Await Key Bank of England Decision
The pound strengthened following the outcome of the US Federal Reserve meeting, where the central bank, as expected, kept interest rates unchanged. However, the Fed did not provide the market with clear signals of an imminent shift towards rate cuts,

Microsoft Analysis: Earnings Beat Expectations
On 29 July 2026, Microsoft reported its results for the fourth quarter of fiscal year 2026. Revenue reached $90 billion, up 18% year-on-year, while adjusted earnings per share came in at $4.74, comfortably ahead of analysts' expectations of $4.

EUR/USD: All Eyes on the Fed as the Range Reaches Its Breaking Point
The dollar's next move hinges on tonight's Fed decision, and this time markets genuinely don't know what to expect. While economists still lean toward a hold—with CME FedWatch odds sitting near 68.5% for no change—Kevin Warsh's hawkish