


FXOpen

Apple, the largest U.S. market-cap company, released its Q3 earnings report on October 31:
→ Earnings per share (EPS): Actual = $0.97, Expected = $1.60
→ Gross revenue: Actual = $94.9 billion, Expected = $94.5 billion
The nearly 40% miss on EPS likely disappointed investors, contributing to bearish pressure. As seen in AAPL’s chart, prices dropped below $220 — a level last seen in early September.
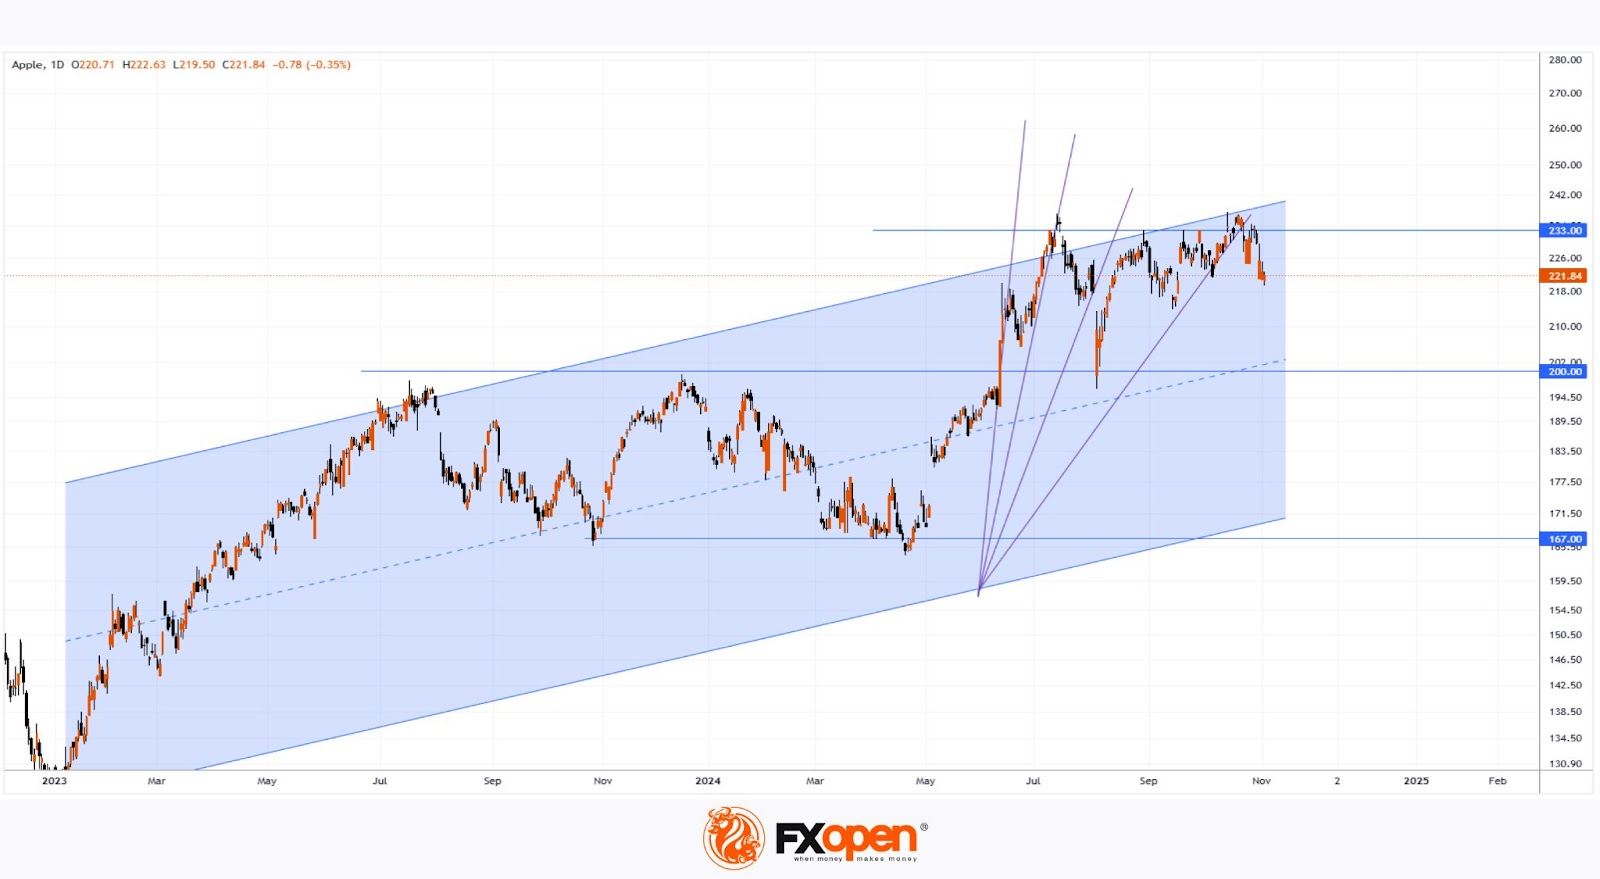
Could the decline deepen? Today’s technical analysis of AAPL presents a few arguments for a bearish outlook:
→ In 2023-2024, the stock moved within a broad range between $167 and $200. When the bullish breakout of this range occurred in June 2024, $233 became a potential target, showing signs of resistance. The resistance around $233 is also reinforced by the upper boundary of a long-term ascending channel (in blue).
→ Trendline slopes have been gradually flattening (in purple), a sign of waning buying momentum.
This weakening demand near $233 may lead to further bearish attempts to push AAPL below $220 toward the median of its long-term rising channel.
Meanwhile, Wall Street analysts remain optimistic. According to TipRanks:
→ 23 of 34 analysts recommend buying AAPL;
→ The average 12-month price target is $245.
Buy and sell stocks of the world's biggest publicly-listed companies with CFDs on FXOpen’s trading platform. Open your FXOpen account now or learn more about trading share CFDs with FXOpen.
This article represents the opinion of the Companies operating under the FXOpen brand only. It is not to be construed as an offer, solicitation, or recommendation with respect to products and services provided by the Companies operating under the FXOpen brand, nor is it to be considered financial advice.
Stay ahead of the market!
Subscribe now to our mailing list and receive the latest market news and insights delivered directly to your inbox.


Latest articles

Market Analysis: GBP/USD Dips Further As EUR/GBP Regains Traction
GBP/USD failed to climb above 1.3500 and corrected some gains. EUR/GBP started a decent increase and might aim for more gains above 0.8700.
Important Takeaways for GBP/USD and EUR/GBP Analysis Today
· The British Pound


Market Insights with Gary Thomson: Oil, US Retail Sales & NFP in Focus
In this video, we’ll explore the key economic events and market trends, shaping the financial landscape. Get ready for insights into financial markets to help you navigate the week ahead. Let’s dive in!
In this episode of Market