


AUD/USD Rises Sharply on Inflation News
FXOpen
The Consumer Price Index for Australia was released this morning. According to ForexFactory:
→ CPI in quarterly terms: actual = 1.0%, expected = 0.8%, previous value = 0.6%;
→ CPI in annual terms: actual = 3.5%, expected = 3.4%, previous value = 3.4%.
Rising inflation figures suggest that the Reserve Bank of Australia's tight monetary policy may continue beyond expectations - which is why the Australian dollar has jumped higher relative to other currencies.
Thus, from the minimum of the year against the US dollar, recorded on April 19, the Ausssie rose in price by more than 2%.
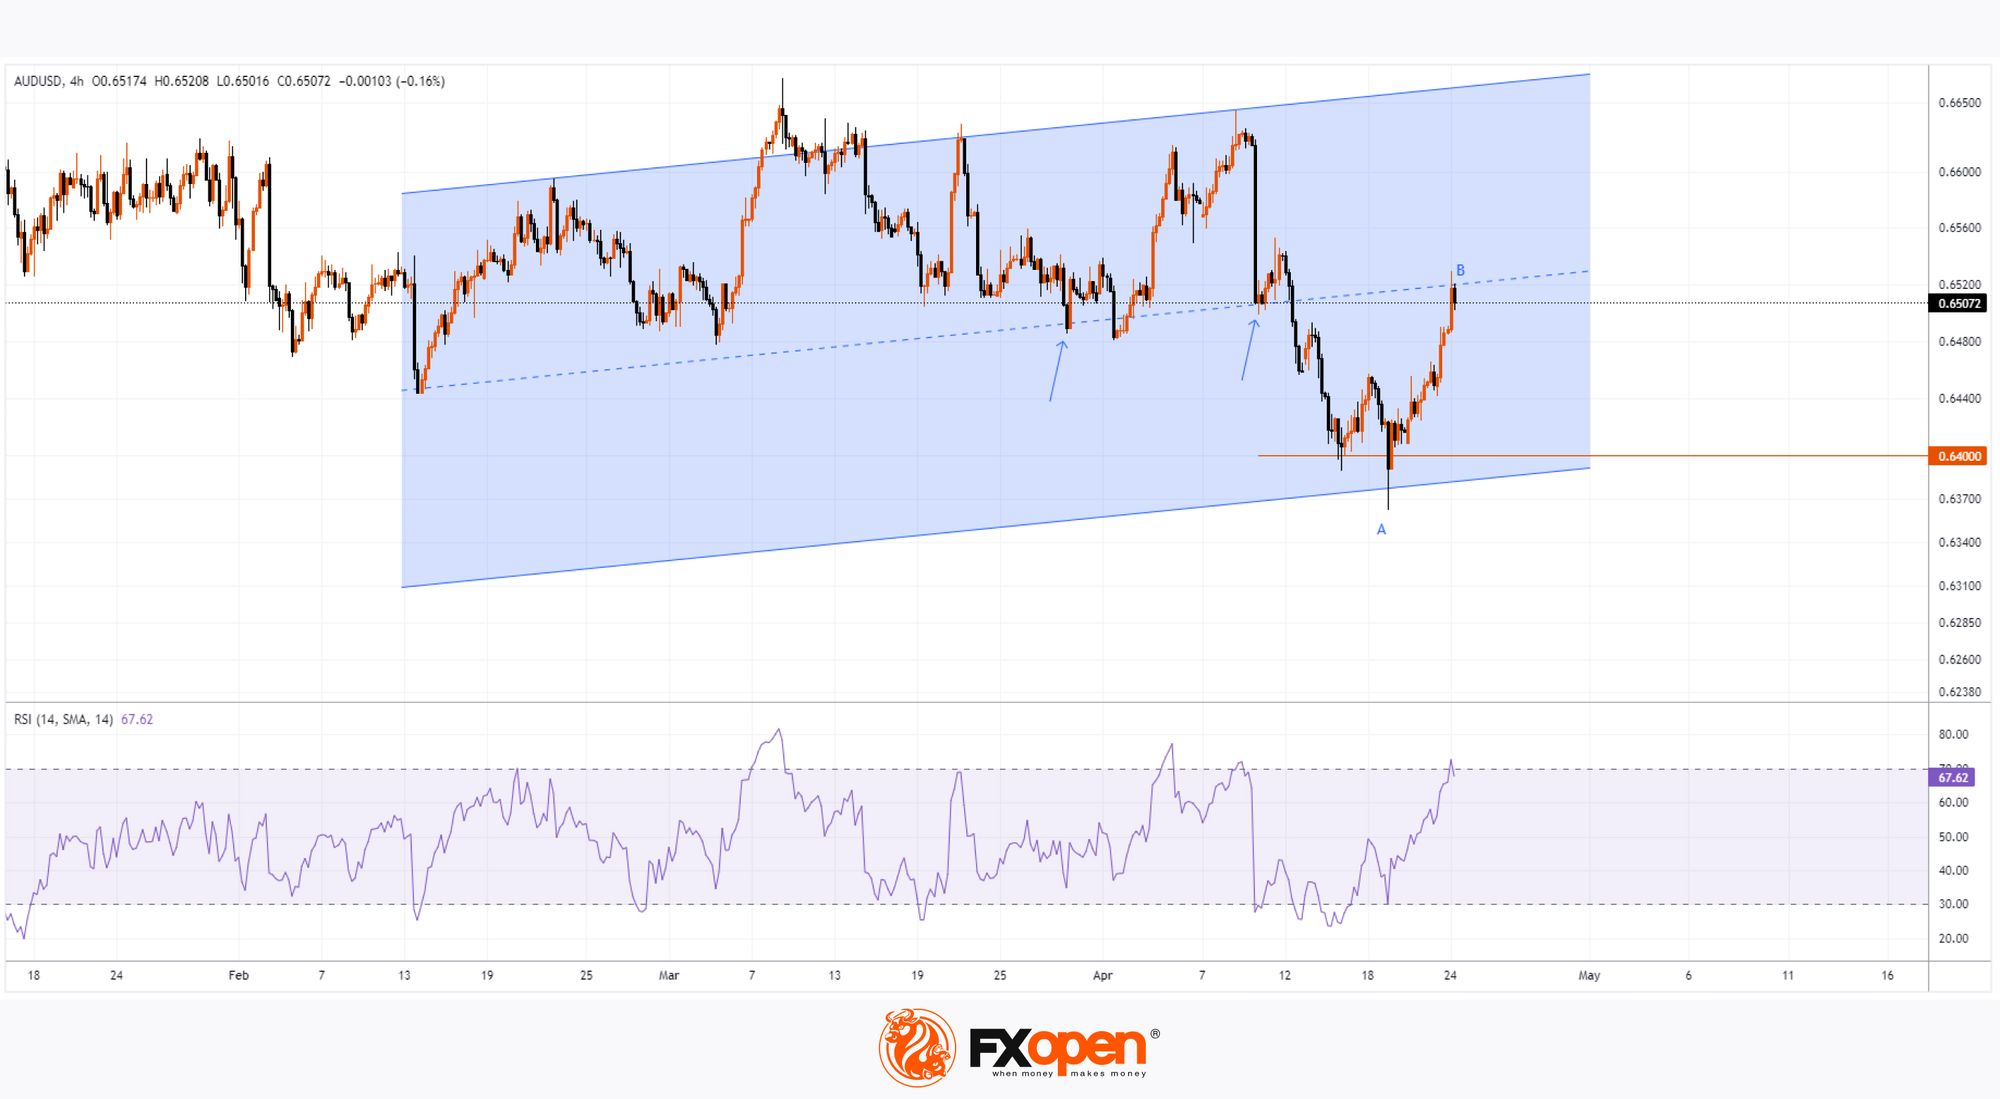
Technical analysis of the AUD/USD chart today shows that:
→ the price has reached the median of the ascending channel. Previously, this line served as support (as shown by the arrows), so there is reason to believe that it will provide resistance after rapid growth;
→ at the same time, the key support appears to be the level of 0.64, where the lower border of the channel lies;
→ the RSI indicator is in the overbought zone.
It is possible that in the short term there will be a correction after a sharp increase in the price of AUD/USD — for example, by 50% of the A→B impulse.
And to assess the long-term outlook, the upcoming release of important data for the United States will provide valuable information:
→ US GDP, tomorrow at 15:30 GMT+3
→ Personal Consumption Expenditures (PCE) USA, on Friday at 15:30 GMT+3.
Trade over 50 forex markets 24 hours a day with FXOpen. Take advantage of low commissions, deep liquidity, and spreads from 0.0 pips (additional fees may apply). Open your FXOpen account now or learn more about trading forex with FXOpen.
This article represents the opinion of the Companies operating under the FXOpen brand only. It is not to be construed as an offer, solicitation, or recommendation with respect to products and services provided by the Companies operating under the FXOpen brand, nor is it to be considered financial advice.
Stay ahead of the market!
Subscribe now to our mailing list and receive the latest market news and insights delivered directly to your inbox.


Latest articles

Ethereum: Has the Recovery Begun?
Ethereum has staged a notable rebound after once again testing the heavily watched psychological zone around 1500$. Since bouncing off this support, ETH/USD has climbed roughly 13%, now trading around the $1,700 mark.
This recovery is being driven

Oil Prices Are Back at Pre-Conflict Levels. Analysts Are Divided
At the start of May, oil markets were still pricing in elevated geopolitical risk and expectations of sustained supply disruption.
But easing tensions between Washington and Tehran, along with improving supply expectations, have rapidly shifted sentiment back toward fundamentals.
📉 Brent

The Dollar Awaits the Week’s Key Report: AUD/USD and NZD/USD at Crucial Technical Levels
Following mixed performance by the US dollar earlier this week, investors are now fully focused on the June Nonfarm Payrolls report, which will be released on Thursday rather than Friday. The schedule has been brought forward as US financial markets