


FXOpen

The XBR/USD chart shows a strong rally in Brent crude oil prices on January 2–3, breaking above $76.20 for the first time since mid-October.
According to Reuters, this surge was driven by:
- Economic stimulus measures in China, including wage increases for public servants and a significant boost in funding through treasury bonds.
- Forecasts of a colder winter in the US and Europe, potentially increasing demand for oil products.
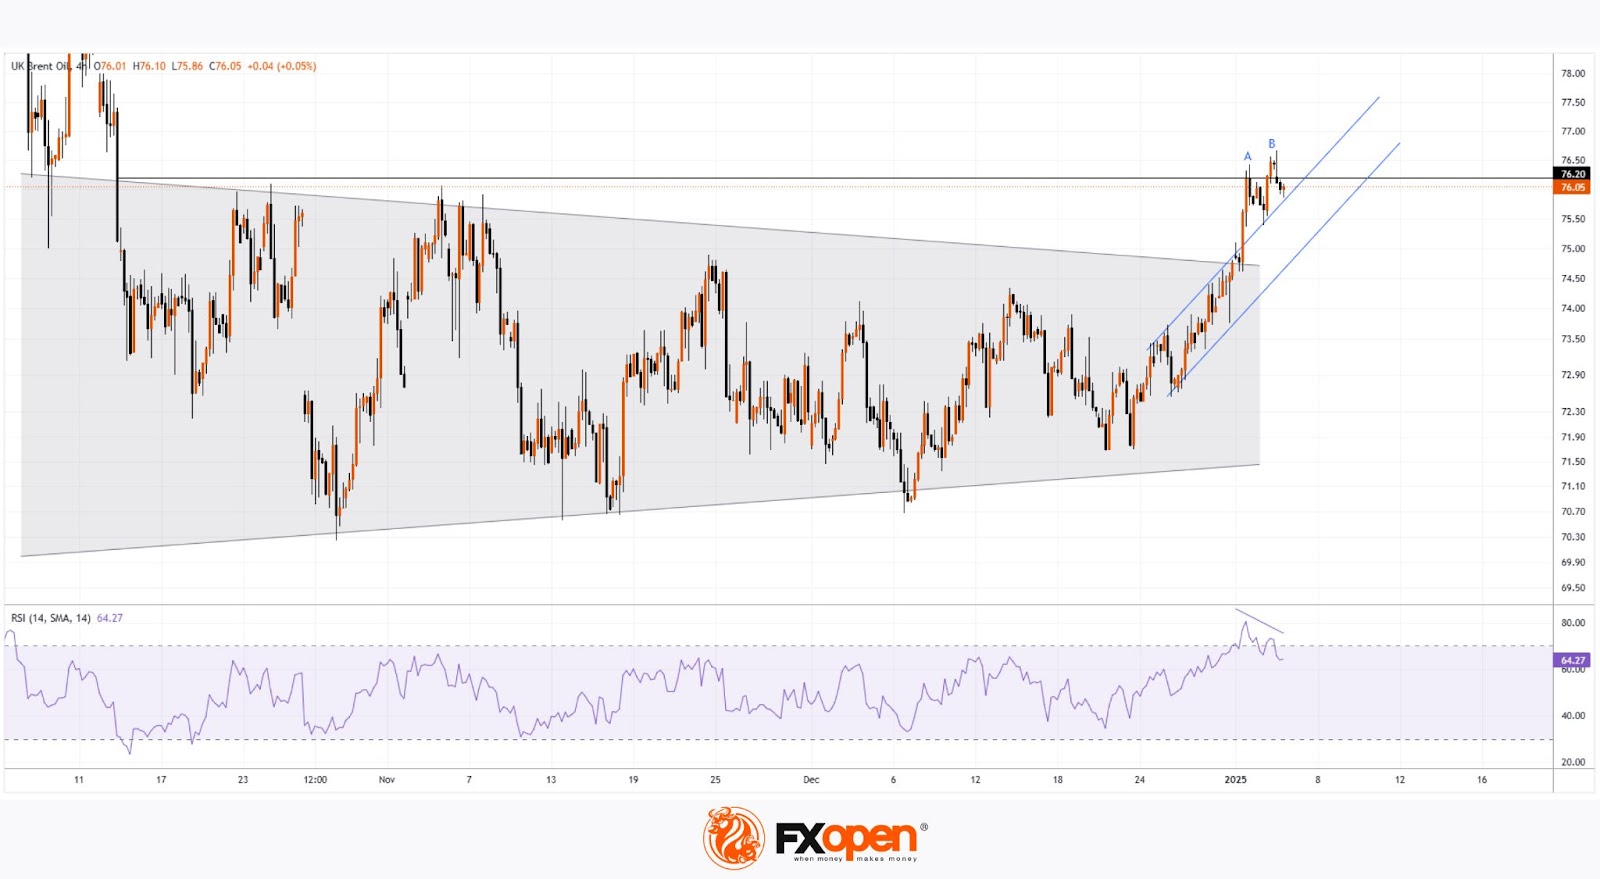
According to technical analysis of the XBR/USD chart, the price broke out of a consolidation pattern (highlighted in blue) that had confined it in late 2024.
However, signs of waning bullish momentum are emerging:
- At point B, the price only slightly surpassed the previous high at point A before reversing downward, indicating buyer weakness.
- A bearish divergence is forming between the RSI indicator and points A and B.
These signals suggest that Brent crude oil prices could be vulnerable to a correction, potentially targeting the lower blue trendline as a support level.
Start trading commodity CFDs with tight spreads (additional fees may apply). Open your trading account now or learn more about trading commodity CFDs with FXOpen.
This article represents the opinion of the Companies operating under the FXOpen brand only. It is not to be construed as an offer, solicitation, or recommendation with respect to products and services provided by the Companies operating under the FXOpen brand, nor is it to be considered financial advice.
Stay ahead of the market!
Subscribe now to our mailing list and receive the latest market news and insights delivered directly to your inbox.


Latest articles

Market Analysis: GBP/USD Dips Further As EUR/GBP Regains Traction
GBP/USD failed to climb above 1.3500 and corrected some gains. EUR/GBP started a decent increase and might aim for more gains above 0.8700.
Important Takeaways for GBP/USD and EUR/GBP Analysis Today
· The British Pound


Market Insights with Gary Thomson: Oil, US Retail Sales & NFP in Focus
In this video, we’ll explore the key economic events and market trends, shaping the financial landscape. Get ready for insights into financial markets to help you navigate the week ahead. Let’s dive in!
In this episode of Market