


FXOpen

Berkshire Hathaway's (BRK.B) Class B shares surpassed $465 this week, while Class A shares exceeded $700,000, pushing the market capitalisation of Warren Buffett's company past the $1 trillion mark. This milestone makes it the first non-tech U.S. company to join the trillion-dollar club, alongside Apple, Nvidia, Microsoft, Alphabet, Amazon, Meta, and Saudi Aramco.
Buffett's success lies in his value investing philosophy, which has allowed him to build a portfolio that consistently outperforms the market. This month is no exception—while the S&P 500 (US SPX 500 mini on FXOpen) has rebounded about 9.4% from its 5 August low, Berkshire Hathaway's Class B shares have surged over 14%.
Can the price climb even higher?
Technical analysis of the BRK.B chart reveals that:
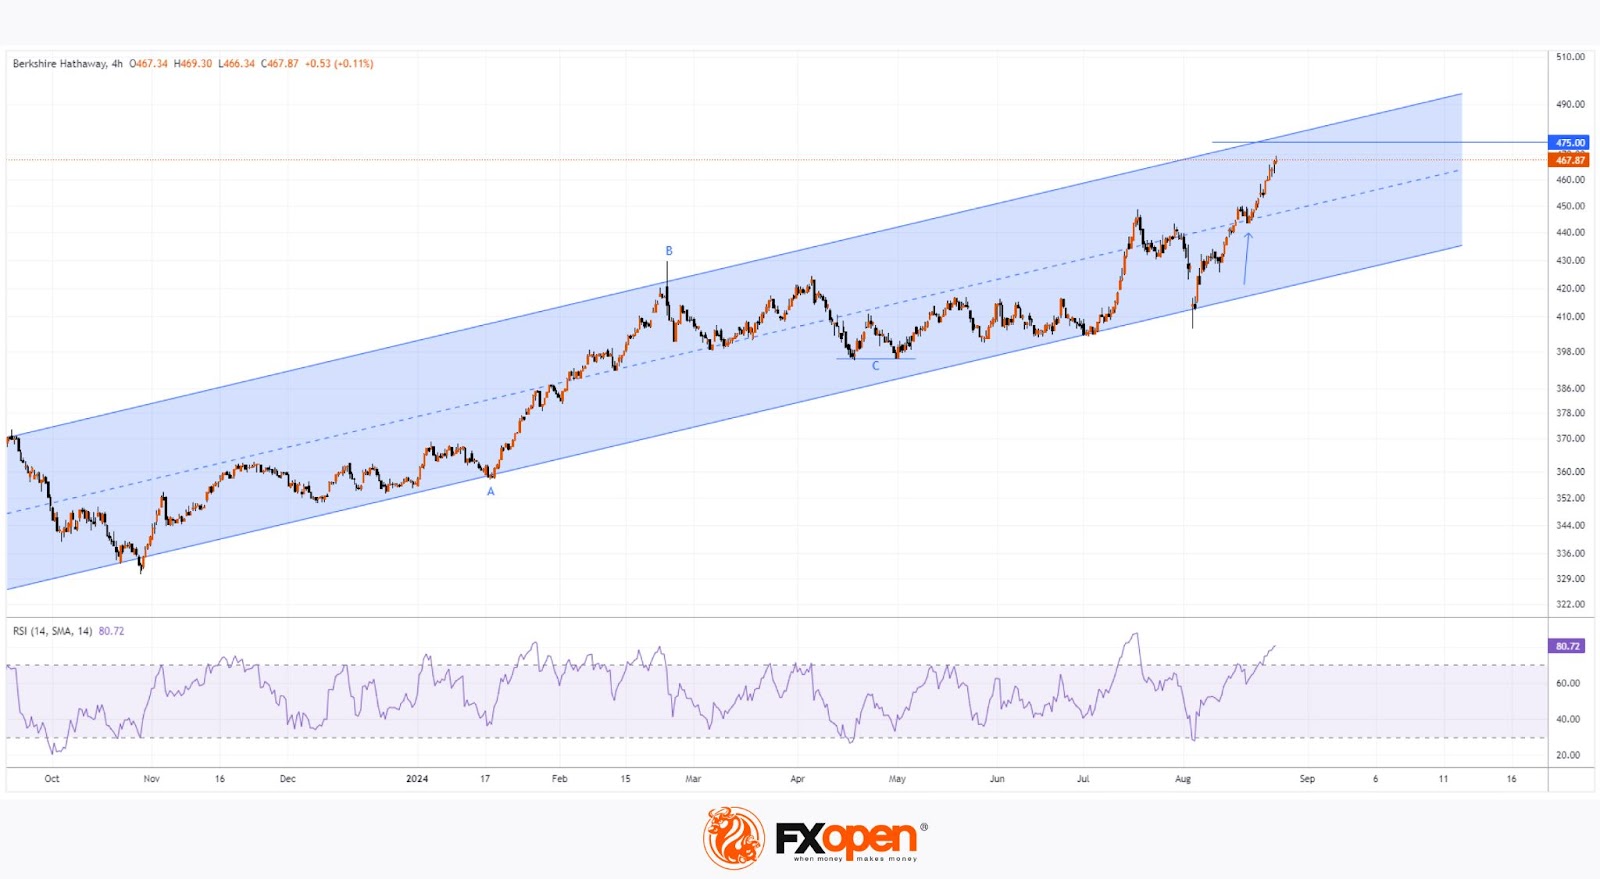
→ Since mid-2023, the price has been forming an upward channel (shown in blue). On 5 August, the price attempted to break below the lower boundary but failed. The long lower wick on that day's candle indicates strong demand.
→ Following 5 August, a steady uptrend emerged without significant pullbacks, lifting the price to the upper half of the channel. The median line acted as support during a test (indicated by an arrow), and the RSI indicator soared into the overbought zone.
→ When analysing 2024 price action using Fibonacci proportions, the B→C retracement is about 0.50 of the A→B impulse. This suggests a target for the current rally could be at the 1.618 level, around $475, which aligns with the upper boundary of the rising channel.
Therefore, as the price approaches $475, the bullish trend may slow down. According to TipRanks, the target price for BRK.B shares is $477 over the next 12 months.
Buy and sell stocks of the world's biggest publicly-listed companies with CFDs on FXOpen’s trading platform. Open your FXOpen account now or learn more about trading share CFDs with FXOpen.
This article represents the opinion of the Companies operating under the FXOpen brand only. It is not to be construed as an offer, solicitation, or recommendation with respect to products and services provided by the Companies operating under the FXOpen brand, nor is it to be considered financial advice.
Stay ahead of the market!
Subscribe now to our mailing list and receive the latest market news and insights delivered directly to your inbox.


Latest articles

European Currencies Decline: Pound Hits New Lows, Euro Under Pressure
European currencies continue to weaken against the US dollar amid rising geopolitical tensions and increased demand for safe-haven and liquid assets. Market participants are reducing exposure to riskier instruments, putting pressure on both the euro and the pound. Additional support

Market Analysis: GBP/USD Dips Further As EUR/GBP Regains Traction
GBP/USD failed to climb above 1.3500 and corrected some gains. EUR/GBP started a decent increase and might aim for more gains above 0.8700.
Important Takeaways for GBP/USD and EUR/GBP Analysis Today
· The British Pound
