


FXOpen

Yesterday, shares of cryptocurrency exchange Coinbase (COIN) underperformed the broader market, falling by approximately 5%.
This decline is part of a worrying trend. While the S&P 500 (US SPX 500 mini on FXOpen) set records in mid-summer, Coinbase (COIN) struggled to surpass its March high. It seems the positive impact of the Bitcoin ETF launch earlier this year has faded.
Additionally, COIN's share price has been affected by a weak earnings report published on 1st August, where earnings per share fell significantly short of expectations (actual = $0.14 vs forecast = $0.95).
Adding to the negative sentiment is the news that if Kamala Harris wins the US presidential election, current SEC Chair Gary Gensler, known for his sceptical stance on cryptocurrencies, might be appointed as Treasury Secretary.
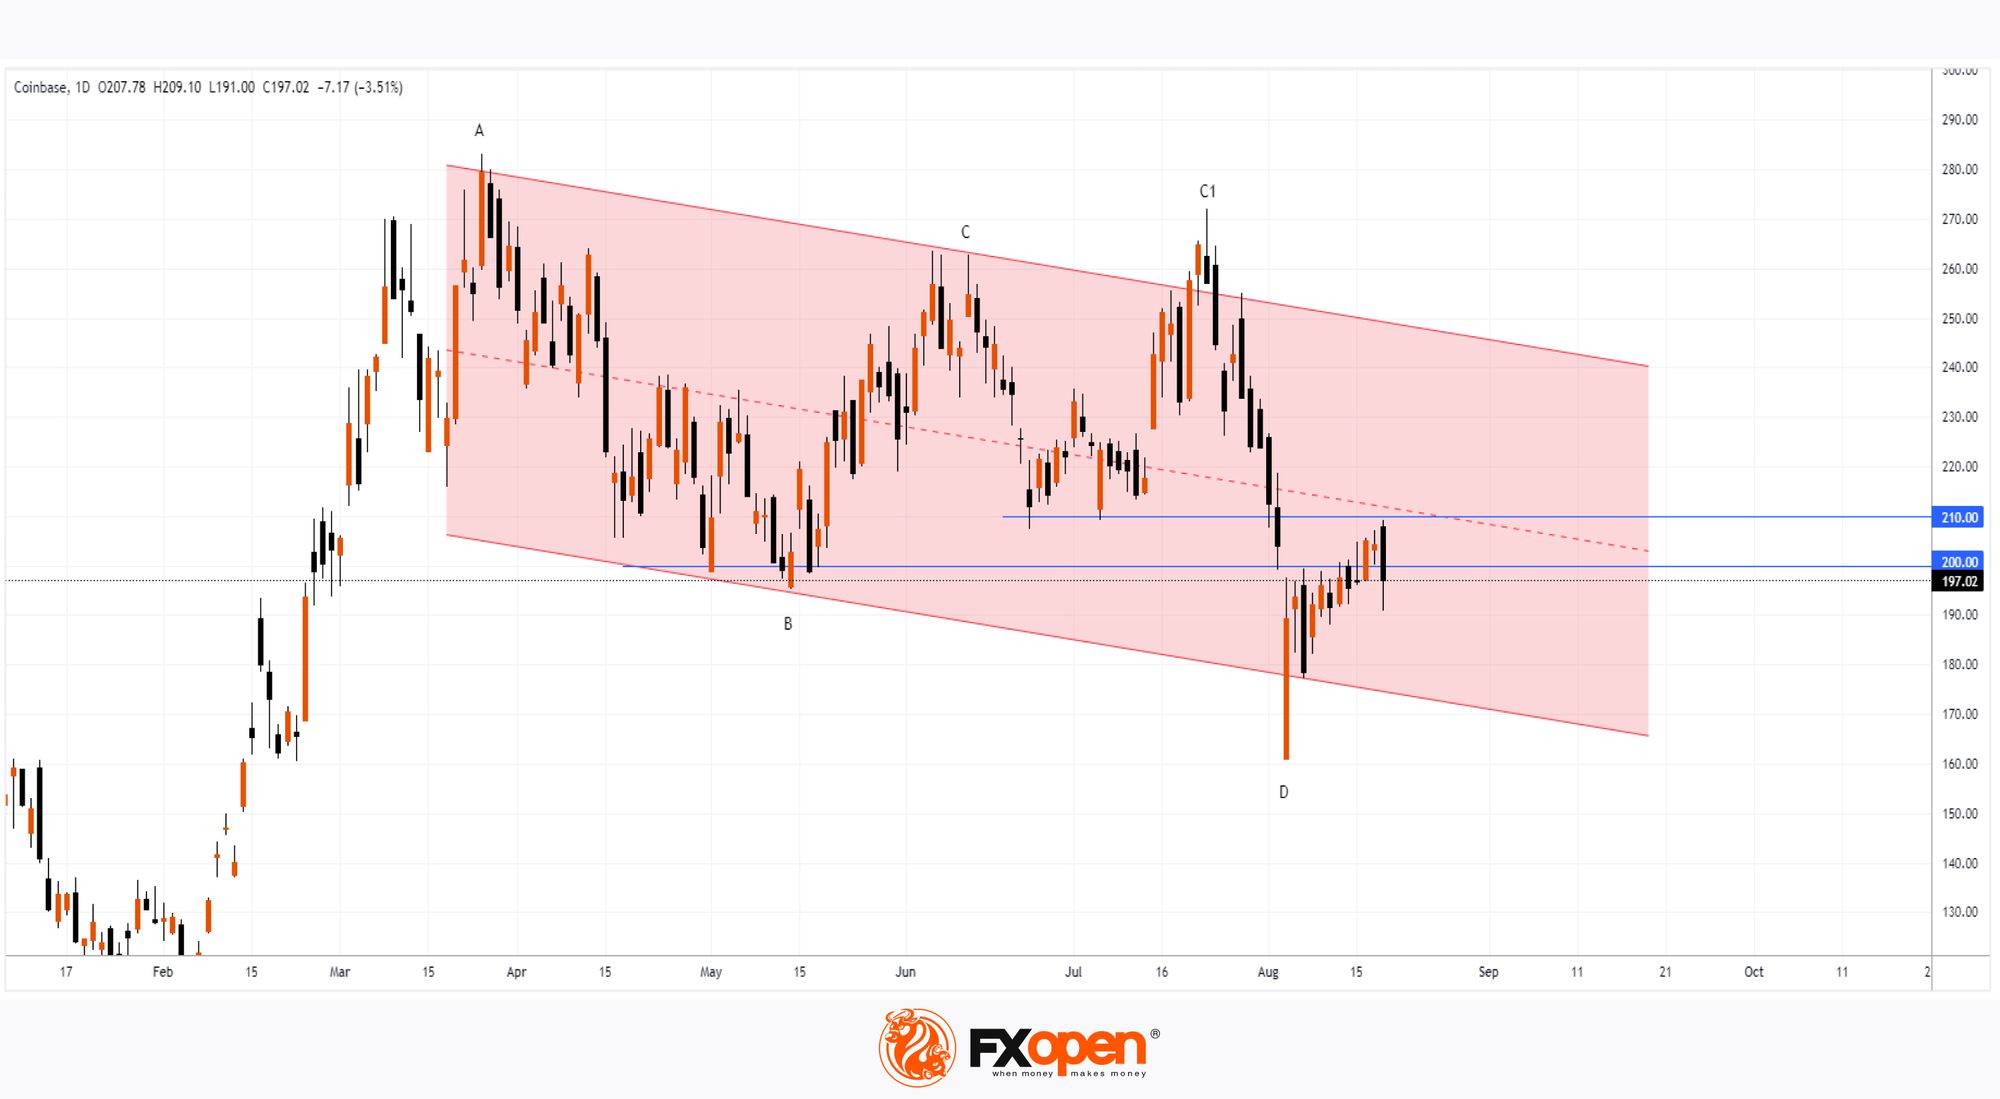
Technical analysis of the COIN chart indicates that price movements are increasingly forming a descending channel (marked in red), with:
→ Swing extremes forming a series of lower highs and lows. The false breakout at peak C1 relative to peak C can be seen as confirmation of bearish strength.
→ The psychological level of $200, which acted as support in May (during the formation of low B), may now serve as resistance, as only two trading days closed above this mark.
→ Another significant resistance level is $210, which served as support in June before being bearishly broken on 2nd August.
The bearish arguments are concerning. The $200-210 zone, reinforced by the median of the descending channel, could be a major obstacle for bulls.
However, analysts remain optimistic. According to average estimates from TipRanks, the target price for COIN is $259 over the next 12 months (+31% from current levels).
Buy and sell stocks of the world's biggest publicly-listed companies with CFDs on FXOpen’s trading platform. Open your FXOpen account now or learn more about trading share CFDs with FXOpen.
This article represents the opinion of the Companies operating under the FXOpen brand only. It is not to be construed as an offer, solicitation, or recommendation with respect to products and services provided by the Companies operating under the FXOpen brand, nor is it to be considered financial advice.
Stay ahead of the market!
Subscribe now to our mailing list and receive the latest market news and insights delivered directly to your inbox.


Latest articles

European Currencies Decline: Pound Hits New Lows, Euro Under Pressure
European currencies continue to weaken against the US dollar amid rising geopolitical tensions and increased demand for safe-haven and liquid assets. Market participants are reducing exposure to riskier instruments, putting pressure on both the euro and the pound. Additional support

Market Analysis: GBP/USD Dips Further As EUR/GBP Regains Traction
GBP/USD failed to climb above 1.3500 and corrected some gains. EUR/GBP started a decent increase and might aim for more gains above 0.8700.
Important Takeaways for GBP/USD and EUR/GBP Analysis Today
· The British Pound
