


FXOpen

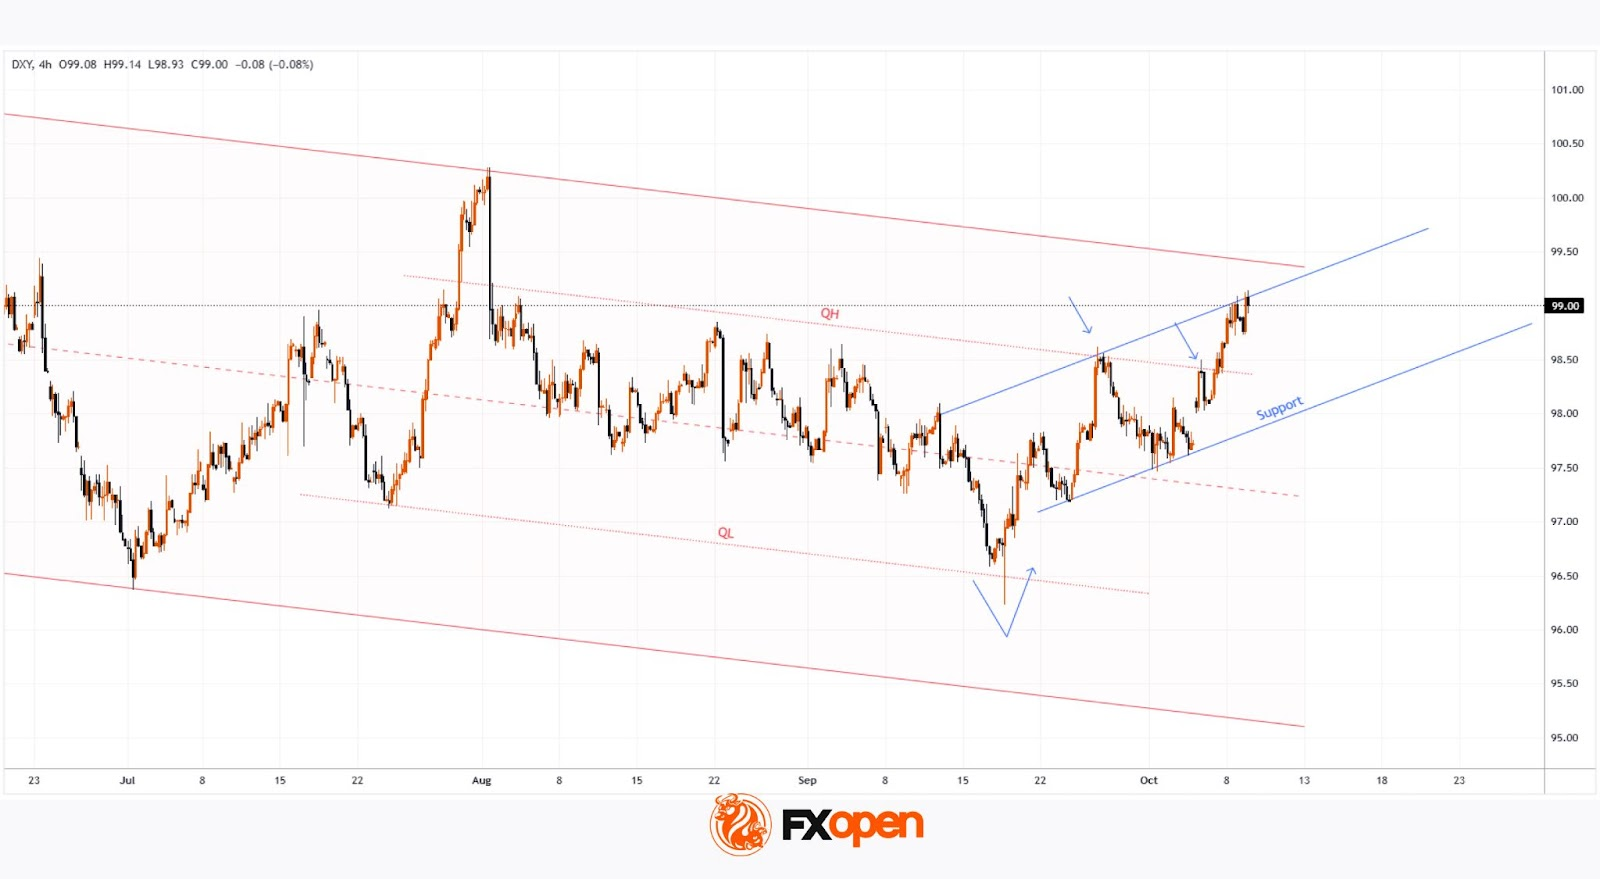
The chart shows the Dollar Index (DXY) trading above the 99-point level today — its highest since early August. The dollar’s strength is supported by the weakening of other currencies:
→ The yen is weakening amid expectations of looser monetary policy. Conservative Sanae Takaichi could become the first female prime minister in Japan’s history, pursuing substantial spending and economic stimulus.
→ The euro remains under pressure amid France’s political crisis. Following the resignation of Prime Minister Sébastien Lecornu’s government, President Emmanuel Macron stated he plans to appoint a new prime minister this week.
Will the Dollar Index continue to rise?
Technical Analysis of the DXY Chart
On 19 September, we provided a significant analysis of the DXY chart in which we:
→ Confirmed the relevance of a descending channel (shown in red), which includes intermediate QL and QH lines dividing the channel into quarters.
→ Highlighted a reversal upward from the QL line (shown with an arrow).
→ Suggested a bullish scenario aiming to reach the QH line.
This scenario has indeed unfolded:
→ On 25 September and 6 October (as shown by arrows), the QH line acted as resistance.
→ On 7 October, it was broken upward, underlining bulls’ strength.
Given this, it is reasonable to suggest that bulls remain in control, while:
→ DXY fluctuations since mid-September’s low are forming an upward channel;
→ its upper boundary may act as resistance, potentially triggering a pullback towards the Support line;
→ the upper boundary of the red channel appears to be a key target for the current rally that began last month.
Trade global index CFDs with zero commission and tight spreads (additional fees may apply). Open your FXOpen account now or learn more about trading index CFDs with FXOpen.
This article represents the opinion of the Companies operating under the FXOpen brand only. It is not to be construed as an offer, solicitation, or recommendation with respect to products and services provided by the Companies operating under the FXOpen brand, nor is it to be considered financial advice.
Stay ahead of the market!
Subscribe now to our mailing list and receive the latest market news and insights delivered directly to your inbox.


Latest articles

Market Insights with Gary Thomson: USD, CAD, and Commodities in Focus
In this video, we’ll explore the key economic events and market trends, shaping the financial landscape. Get ready for insights into financial markets to help you navigate the week ahead. Let’s dive in!
In this episode of Market

USD/CHF Exchange Rate Rebounds from Multi-Year Low
The resilience of the Swiss economy and inflation remaining below 1% have made the Swiss franc an attractive safe-haven asset amid an extremely tense geopolitical backdrop and elevated gold prices. As the USD/CHF chart shows, the US dollar fell

Palantir Technologies (PLTR) Shares Show Strong Growth at the Beginning of March
Shares of Palantir Technologies (PLTR), a company specialising in big data analytics software, have become one of the stock market’s standout performers at the start of this spring.
While the closing price on the last trading day of February