


FXOpen

On Friday, data from the Personal Consumption Expenditures (PCE) index was published. According to Trading Economics, the PCE price index report showed that inflation is slowing. On a monthly basis, it grew by 0.3% in February, forecast = 0.4%, a month ago = 0.4%.
Following the release of the PCE index, Jerome Powell stated that:
→ the Fed is in no hurry to cut interest rates;
→ the latest PCE inflation data is in line with what the Fed wants to see.
Market participants received a portion of fundamental information positively. And since Friday was a day off on the stock market, the news is taken into account by the price on Monday.
The E-mini S&P-500 opened with a gap this morning, and at a historical peak. The S&P 500 rose 10.2% in the first quarter, its best performance since 2019. The bull run is fueled by both expectations of Fed interest rate cuts and enthusiasm surrounding the adoption of AI.
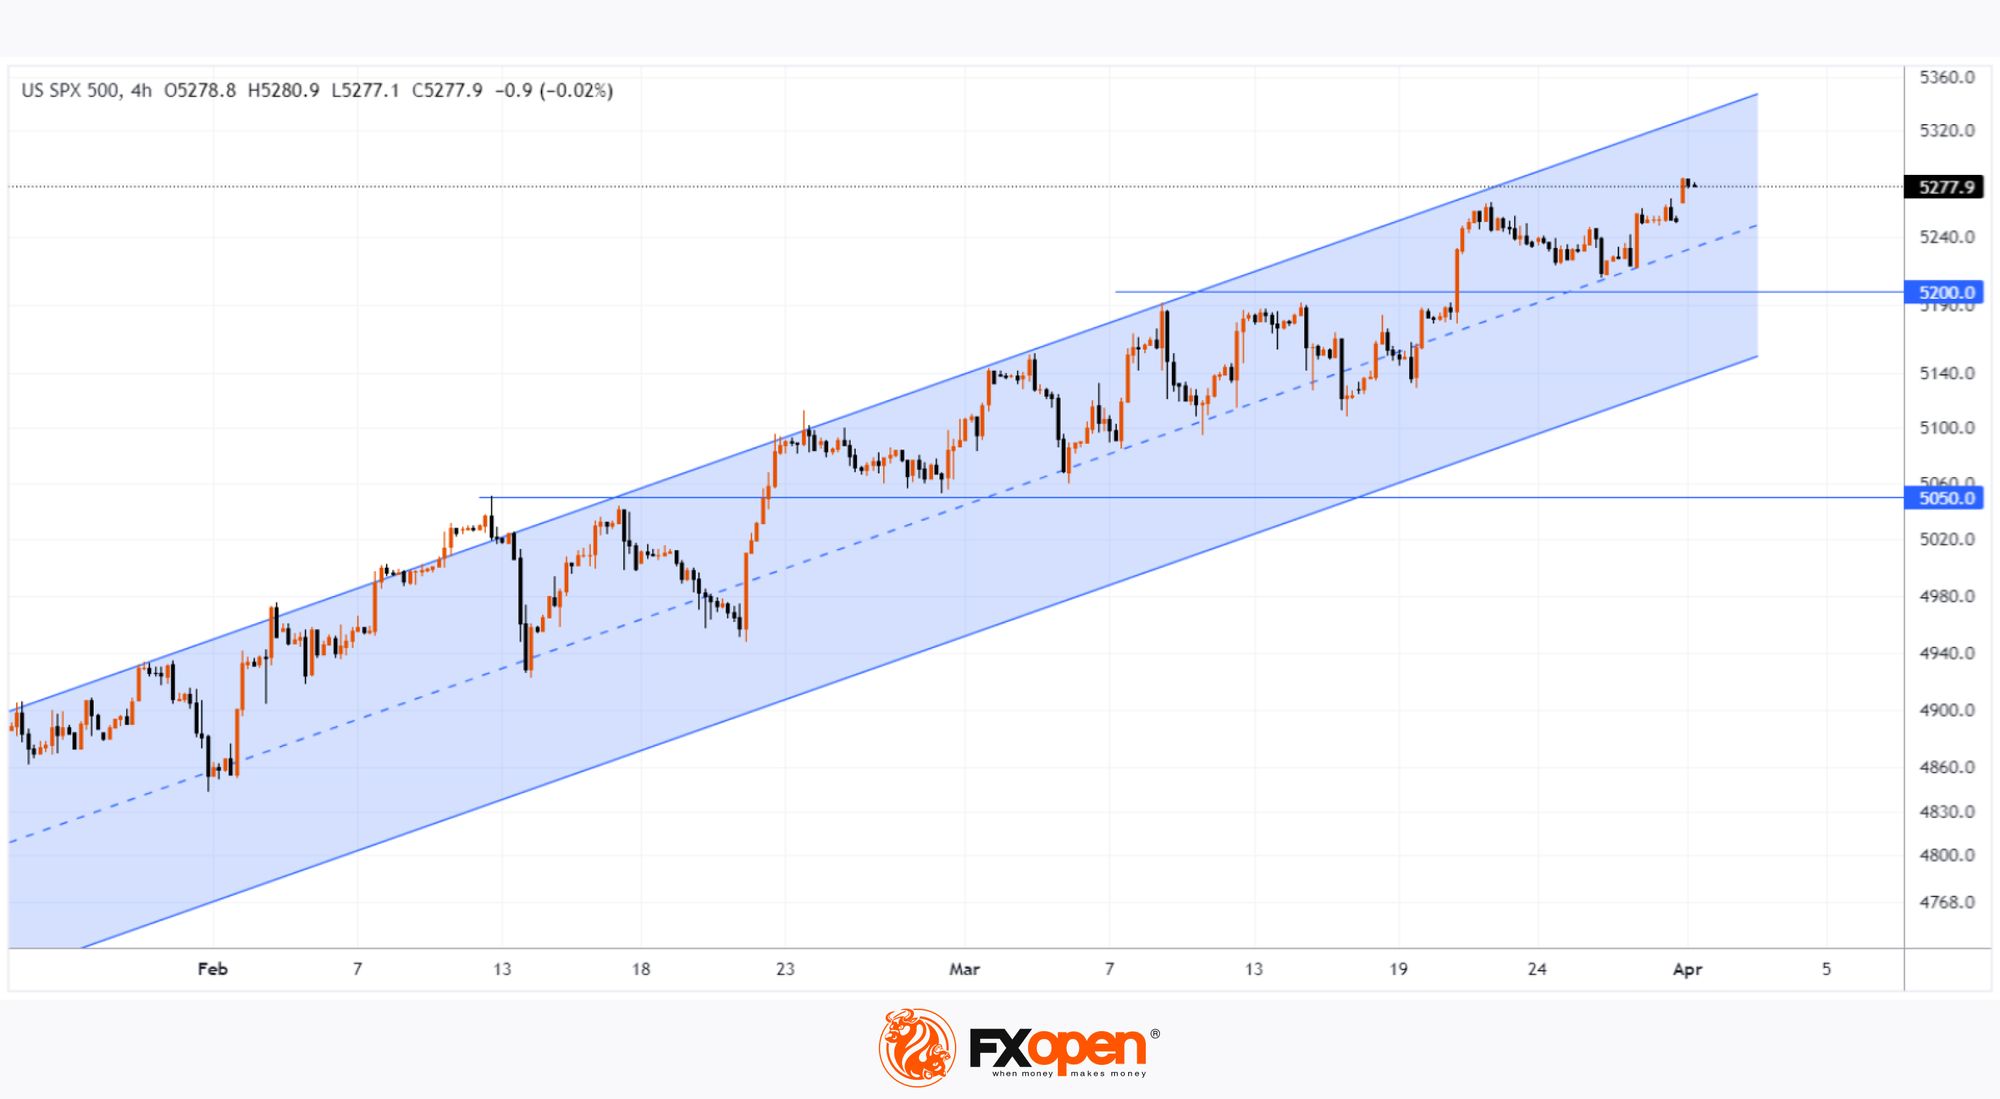
The S&P 500 chart shows that:
→ The price moves in an ascending channel (shown in blue), demonstrating stable demand.
→ The price has broken through the resistance level of 5,200. It is acceptable to expect that it will act as resistance.
→ The market can be supported by the median line.
The current price action after the breakout of the 5,200 level is similar to what happened after the breakout of the 5,050 level — the bulls kept the price at the reached height. If the positivity continues, the price of the S&P-500 may reach the upper limit of the channel — which means exceeding the level of 5,300 points.
Trade global index CFDs with zero commission and tight spreads (additional fees may apply). Open your FXOpen account now or learn more about trading index CFDs with FXOpen.
This article represents the opinion of the Companies operating under the FXOpen brand only. It is not to be construed as an offer, solicitation, or recommendation with respect to products and services provided by the Companies operating under the FXOpen brand, nor is it to be considered financial advice.
Stay ahead of the market!
Subscribe now to our mailing list and receive the latest market news and insights delivered directly to your inbox.


Latest articles

Market Analysis: GBP/USD Dips Further As EUR/GBP Regains Traction
GBP/USD failed to climb above 1.3500 and corrected some gains. EUR/GBP started a decent increase and might aim for more gains above 0.8700.
Important Takeaways for GBP/USD and EUR/GBP Analysis Today
· The British Pound


Market Insights with Gary Thomson: Oil, US Retail Sales & NFP in Focus
In this video, we’ll explore the key economic events and market trends, shaping the financial landscape. Get ready for insights into financial markets to help you navigate the week ahead. Let’s dive in!
In this episode of Market