


FXOpen
As the chart of Eli Lilly's (LLY) share price shows today, yesterday's trading closed at a level more than 9% higher than Wednesday's closing price. The main driver of this growth was a strong Q2 report:
→ Earnings per share: actual = $3.92, expected = $2.74;
→ Gross sales: actual = $11.3 billion, expected = $9.99 billion.
Market participants reacted positively not only to the fact that the American pharmaceutical company's actual results significantly exceeded forecasts but also to Eli Lilly's rising expectations for the second half of the year, driven by demand for its diabetes treatment Mounjaro and weight loss drug Zepbound.
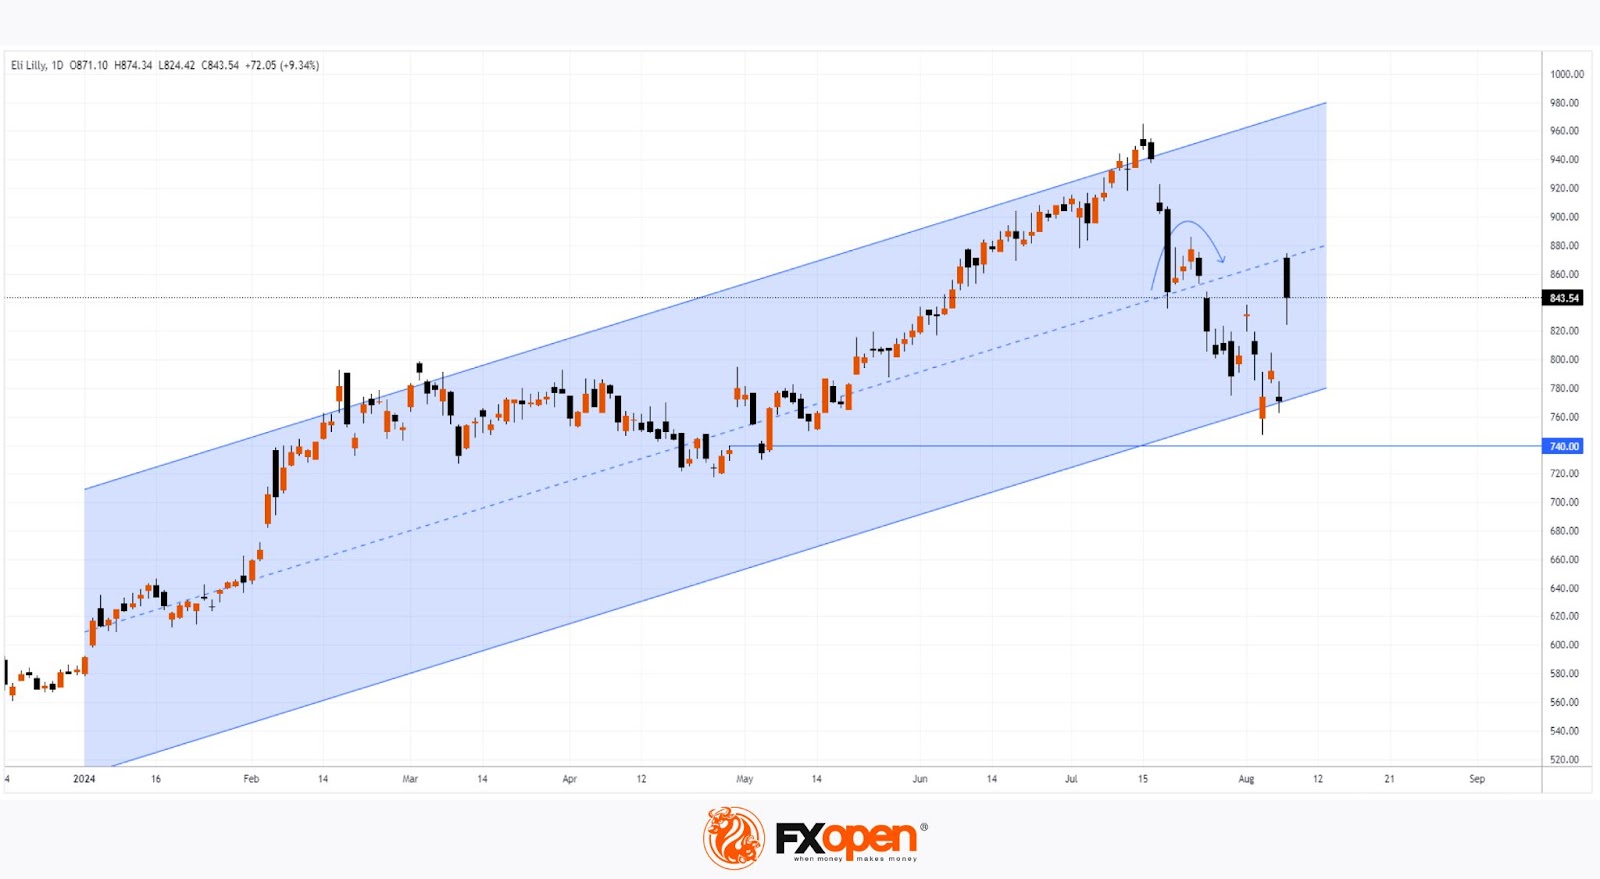
Technical analysis of the Eli Lilly (LLY) stock chart shows that:
→ The price action is forming an upward channel in 2024 (shown in blue);
→ After a rebound, the median line of this channel was breached (as indicated by the arrow);
→ As could be expected, this line acted as resistance – as indicated by the high of yesterday's candlestick.
What is the forecast for Eli Lilly (LLY) shares?
Wall Street analysts surveyed by TipRanks remain positive – none of them recommend selling shares of the company, which has the largest market cap in the healthcare sector at over $800 billion. On average, they forecast that LLY shares will reach $955 within 12 months.
This suggests that the current upward channel may remain relevant. However, it’s possible that:
→ The lower boundary will continue to act as support;
→ The boundaries of the bullish gap formed at yesterday's opening may also provide support. A similar action can be seen on the chart – after a wide bullish gap (also formed following a strong report) on 30 April, LLY shares found support near the lower boundary of that gap around $740.
Buy and sell stocks of the world's biggest publicly-listed companies with CFDs on FXOpen’s trading platform. Open your FXOpen account now or learn more about trading share CFDs with FXOpen.
This article represents the opinion of the Companies operating under the FXOpen brand only. It is not to be construed as an offer, solicitation, or recommendation with respect to products and services provided by the Companies operating under the FXOpen brand, nor is it to be considered financial advice.
Stay ahead of the market!
Subscribe now to our mailing list and receive the latest market news and insights delivered directly to your inbox.


Latest articles

European Currencies Decline: Pound Hits New Lows, Euro Under Pressure
European currencies continue to weaken against the US dollar amid rising geopolitical tensions and increased demand for safe-haven and liquid assets. Market participants are reducing exposure to riskier instruments, putting pressure on both the euro and the pound. Additional support

Market Analysis: GBP/USD Dips Further As EUR/GBP Regains Traction
GBP/USD failed to climb above 1.3500 and corrected some gains. EUR/GBP started a decent increase and might aim for more gains above 0.8700.
Important Takeaways for GBP/USD and EUR/GBP Analysis Today
· The British Pound
