


ETH/BTC Hits 44-Month Low
FXOpen

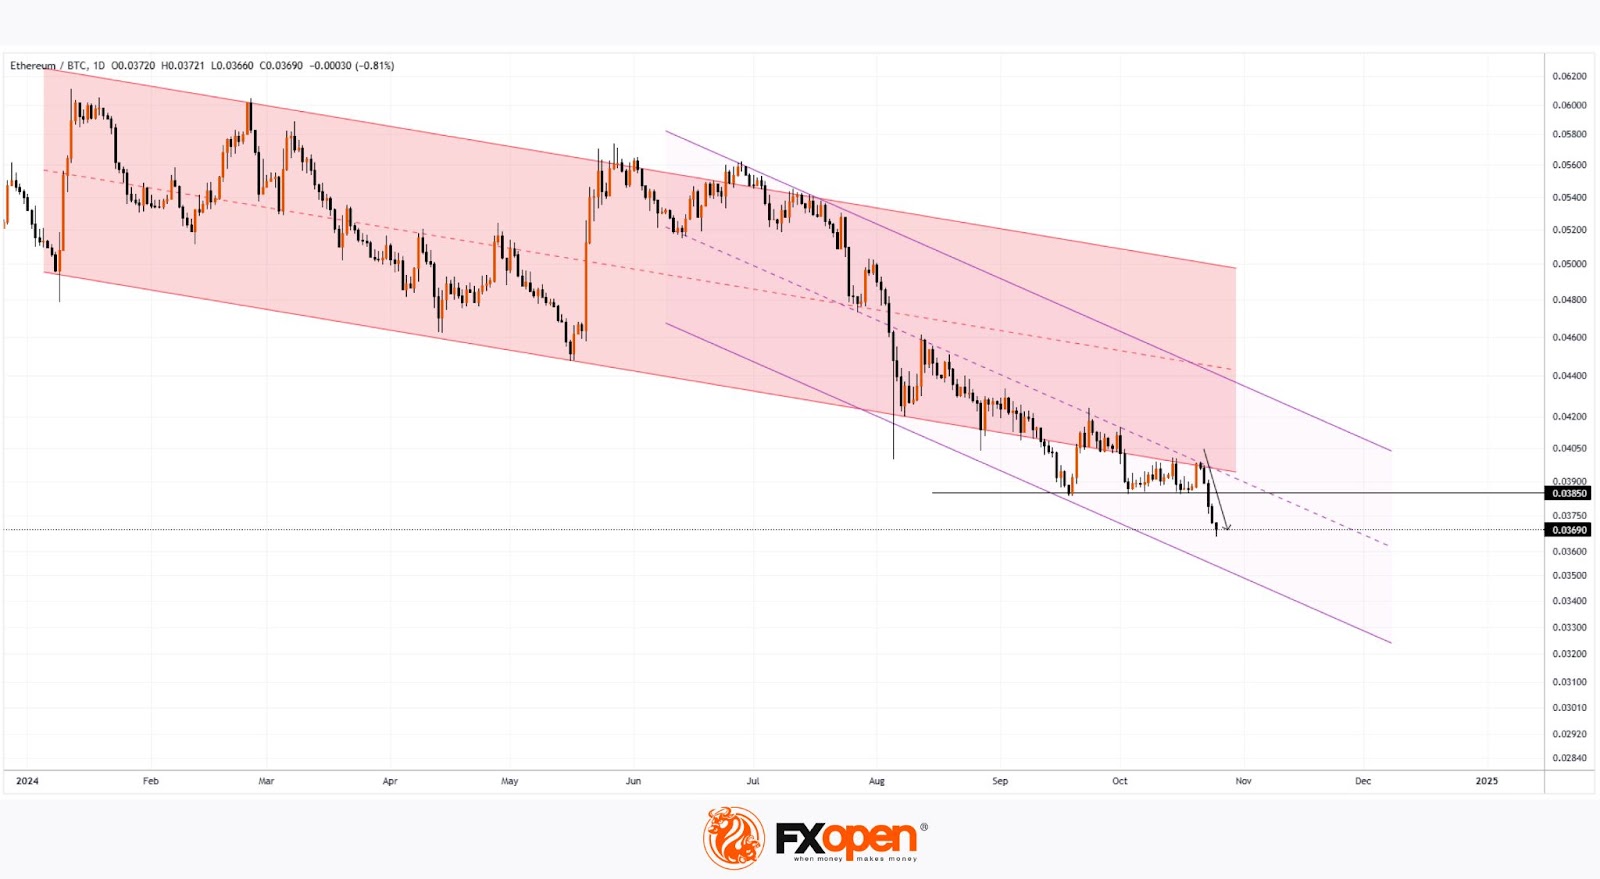
The ETH/BTC exchange rate has reached its lowest level in 44 months, as shown on the ETH/BTC chart, indicating that in 2024, cryptocurrency investors seem to favour Bitcoin over Ethereum.
The downward trend, shown by the red channel, has driven ETH/BTC down over 30% since the start of the year. Key factors behind this decline include:
→ Approval of a Bitcoin ETF, which has made Bitcoin investments more accessible to a broader audience;
→ Intense competition for Ethereum from other blockchains that support decentralized applications.
Currently, ETH/BTC stands at 0.037, a level last seen in April 2021.
Technical Analysis of ETH/BTC Chart:
→ The price has moved below the red channel, forming a steeper trajectory shown by the purple channel;
→ The 0.03850 level, which had been supporting the price since September, has been breached and may now serve as resistance.
According to Bloomberg, options market analysis suggests investors expect Bitcoin to reach $80,000 regardless of the U.S. presidential election outcome. This has contributed to a series of bearish candles on the chart (indicated by an arrow).
Should Bitcoin inflows increase as elections approach, ETH/BTC may continue its downward trend, moving toward the lower boundary of the purple channel.
FXOpen offers the world's most popular cryptocurrency CFDs*, including Bitcoin and Ethereum. Floating spreads, 1:2 leverage — at your service (additional fees may apply). Open your trading account now or learn more about crypto CFD trading with FXOpen.
*Important: At FXOpen UK, Cryptocurrency trading via CFDs is only available to our Professional clients. They are not available for trading by Retail clients. To find out more information about how this may affect you, please get in touch with our team.
This article represents the opinion of the Companies operating under the FXOpen brand only. It is not to be construed as an offer, solicitation, or recommendation with respect to products and services provided by the Companies operating under the FXOpen brand, nor is it to be considered financial advice.
Stay ahead of the market!
Subscribe now to our mailing list and receive the latest market news and insights delivered directly to your inbox.


Latest articles

Ripple: Letter to Congress Stirs the Crypto Market
At the beginning of June, more than 200 crypto companies and industry groups — including Coinbase, Andreessen Horowitz and Ripple Labs — sent a letter to Senate Majority and Minority Leaders John Thune and Chuck Schumer, urging them to bring the Digital

GBP/JPY: Ascending Triangle Under Pressure
The GBP/JPY pair has come under pressure after the Bank of Japan raised its policy rate to 1.0% on 16 June. The Bank of England is following the opposite path: at its 30 April meeting, the Monetary Policy
Pound Under Pressure: Markets Await Bank of England And SNB Decisions
The British pound remains under pressure following weaker-than-expected inflation data, which has reinforced expectations of further monetary easing by the Bank of England. Investors are staying cautious ahead of today’s policy meetings of both the UK central bank and