


FXOpen

Analysing the EUR/USD chart five days ago, we:
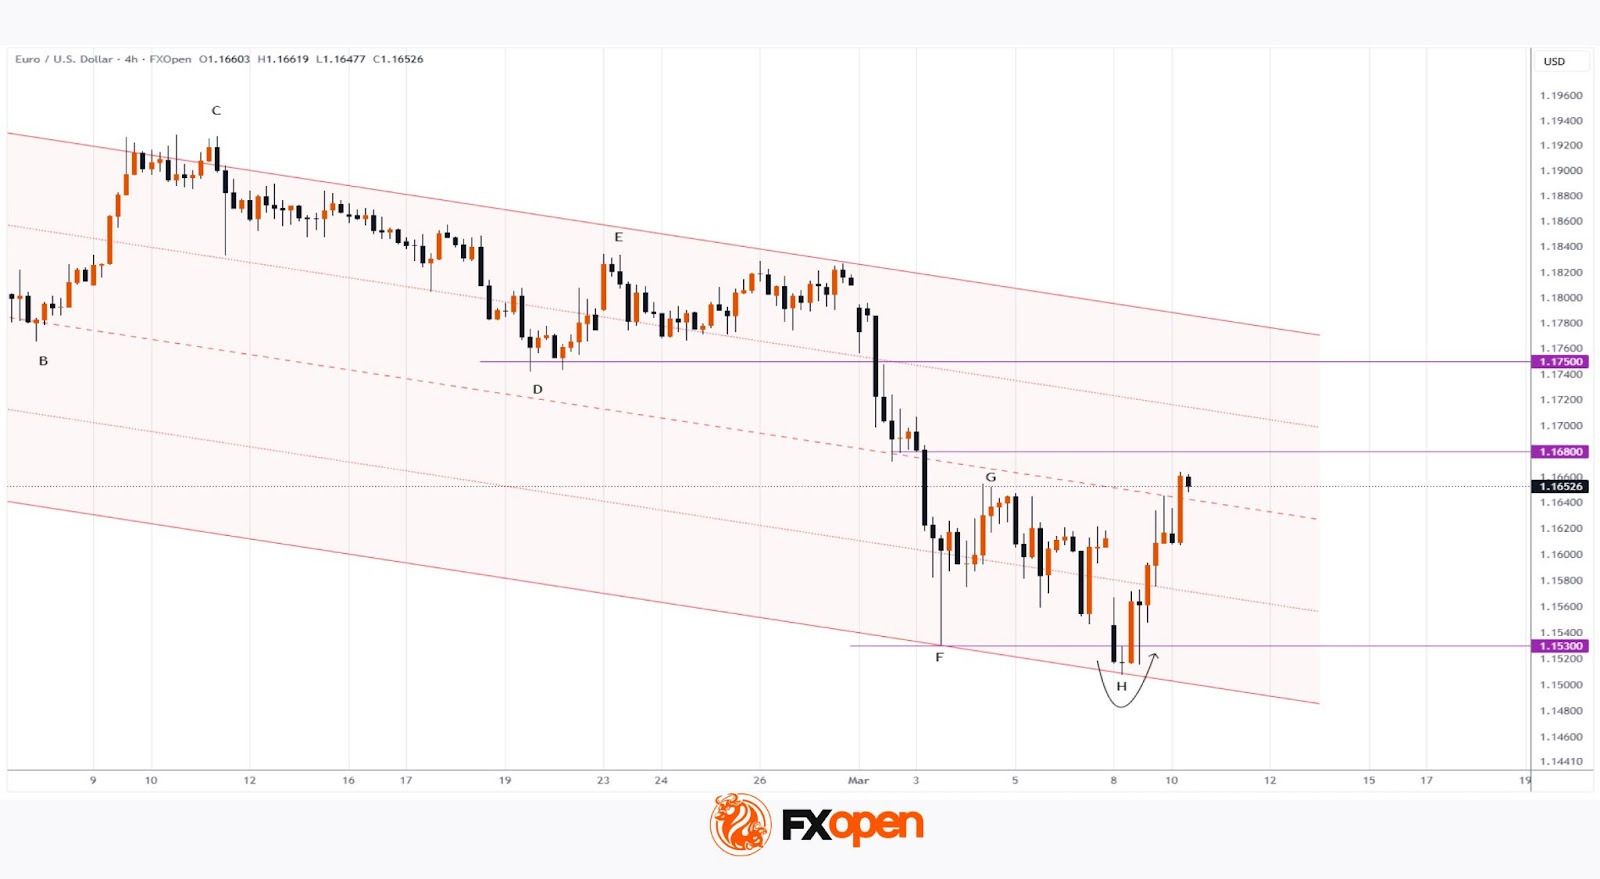
→ constructed a downward channel, noting signs that the bears remained in control;
→ outlined a scenario in which the rate would decline to a new yearly low (and test the lower boundary of the channel).
Yesterday’s price action confirmed these assumptions – the low at H is below the low of 3 February (F), refining the lower boundary of the channel. At the same time, the sharp upward reversal (shown by the arrow) indicates increasing demand, driven by a shift in sentiment due to several factors, including:
→ Trump’s speech, in which the president stated that the war in Iran is progressing successfully and that he has contingency plans for any scenario. This cooled demand for the USD as a safe-haven asset.
→ Expectations of US inflation data scheduled for release tomorrow.
Technical Analysis of the EUR/USD Chart
Recent developments mean that the previously formed sequence of lower extremes A–B–C–D–E–F has been extended with new turning points G and H. However, the EUR/USD chart suggests that this sequence has already been disrupted.
Note that:
→ the price has confidently recovered after yesterday’s bearish gap at the market open;
→ the drop below the F low near the 1.1530 level was extremely brief (a sign of a bullish Liquidity Grab pattern);
→ the market may be sensing the proximity of the psychological 1.1500 level.
Moreover, demand-side forces are today attempting to push the price into the upper half of the channel. Therefore, forex traders should not rule out the possibility of a further recovery in EUR/USD from the fresh yearly low. In this case, former support levels at 1.1680 and 1.1750 may act as resistance to further gains.
Trade over 50 forex markets 24 hours a day with FXOpen. Take advantage of low commissions, deep liquidity, and spreads from 0.0 pips (additional fees may apply). Open your FXOpen account now or learn more about trading forex with FXOpen.
This article represents the opinion of the Companies operating under the FXOpen brand only. It is not to be construed as an offer, solicitation, or recommendation with respect to products and services provided by the Companies operating under the FXOpen brand, nor is it to be considered financial advice.
Stay ahead of the market!
Subscribe now to our mailing list and receive the latest market news and insights delivered directly to your inbox.


Latest articles

Consolidation Ahead of NFP: Commodity Currencies Search for Direction
Commodity-linked currencies have entered a consolidation phase following recent directional moves, as market participants adopt a wait-and-see approach ahead of key US labour market data. Current price action reflects a balance between ongoing demand for the US dollar and attempts

The Real Driver Behind the Dollar Rally: Market Insights with Gary Thomson
The US dollar has been firm, but the drivers behind the move may be more complex than they first appear.
While geopolitical tension and shifts in risk sentiment play a role, current price behaviour seems increasingly influenced by inflation expectations

EUR/USD and USD/CHF Pull Back: Market Reacts to Fundamentals
European currencies have shown a recovery in recent trading sessions after their recent decline, displaying early signs of a reversal. The US dollar is weakening amid expectations surrounding upcoming US macroeconomic data, while market participants are reassessing their short-term positions