


EUR/USD Falls Below 1.11 Support
FXOpen

On 26 August, we discussed the potential for a pullback after the rally to 1.12, noting:
→ The fluctuations since April formed an ascending channel (indicated in blue, with support points marked by circles), and the price was near its upper boundary, where resistance was likely;
→ The 1.12 level also showed signs of resistance – the price briefly exceeded it before quickly falling back below; → Bearish divergence on the RSI indicator.
Just three days later, bearish signals continued to develop, leading to:
→ The formation of a bearish "head and shoulders" pattern (H&S) on the chart;
→ A more than 1% decline in price, breaking below the 1.11 level, which had provided support since 21 August.
Could EUR/USD continue to decline?
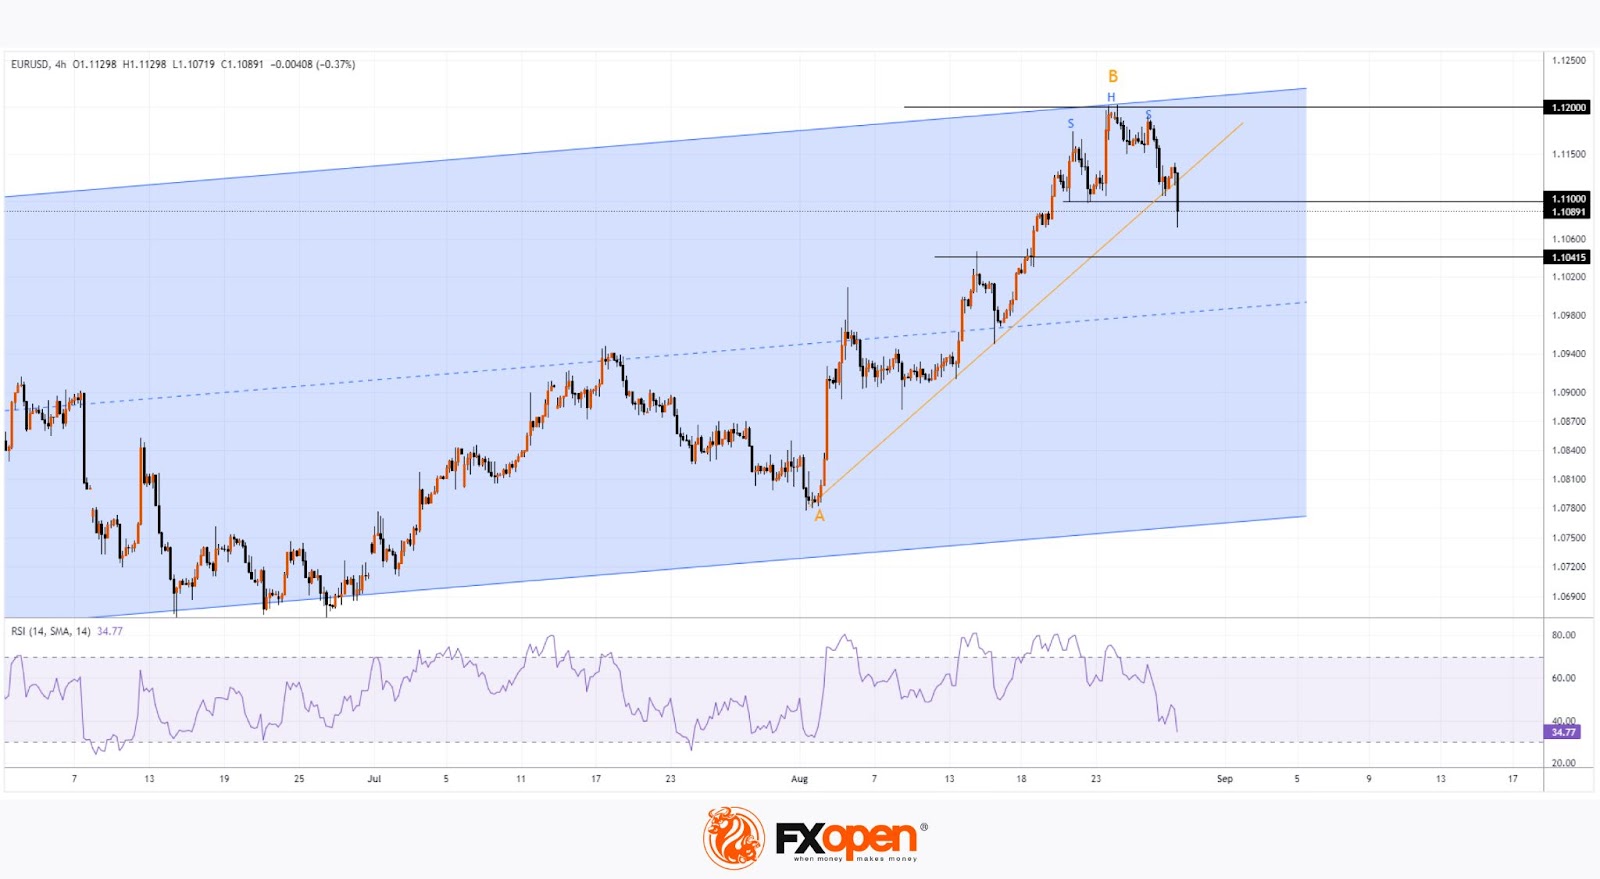
Technical analysis of the EUR/USD chart shows:
→ The RSI indicator has exited the overbought zone and fallen below the 50 line, approaching the oversold zone – a sign of changing market sentiment;
→ The price has broken the trendline (indicated in orange).
Today's decline in EUR/USD was also influenced by news of weakening inflation in Germany and Spain, which could prompt the ECB to ease its monetary policy.
If this is a correction after the significant A→B rally of 3.8% since the beginning of the month, the target could be around 1.10415 – a level that acted as resistance in mid-August. Additionally, this area coincides with:
→ The 0.618 Fibonacci retracement level, drawn between points A and B;
→ The target for a decline based on the height of the H&S pattern.
However, it's possible that bulls may regain control sooner and attempt to push the price back into the 1.110-1.120 range.
Trade over 50 forex markets 24 hours a day with FXOpen. Take advantage of low commissions, deep liquidity, and spreads from 0.0 pips (additional fees may apply). Open your FXOpen account now or learn more about trading forex with FXOpen.
This article represents the opinion of the Companies operating under the FXOpen brand only. It is not to be construed as an offer, solicitation, or recommendation with respect to products and services provided by the Companies operating under the FXOpen brand, nor is it to be considered financial advice.
Stay ahead of the market!
Subscribe now to our mailing list and receive the latest market news and insights delivered directly to your inbox.


Latest articles

CAD/JPY: The Yen's Most Historic Move in 30 Years Meets a Fragile Support
Two central banks are heading in genuinely opposite directions this week, and the tension is unmistakable. The Bank of Canada held rates steady at 2.25% on September 2, with a mildly hawkish tilt as policymakers acknowledged a broadening economic

USD/JPY and USD/CAD Await Key Fed Decision
The US dollar is consolidating against the yen and Canadian dollar ahead of the key event of the week — the Federal Reserve meeting. The Fed is widely expected to raise its policy rate by 25 basis points to a range

UnitedHealth: Fundamentals Are Healing, Now the Chart Must Agree
UnitedHealth finds itself in a genuinely split narrative right now, trading near $388, down about 15.9% from its 52-week high, even as the fundamental picture keeps improving. Q2 earnings beat expectations, with revenue of $112.03 billion, and the