


FXOpen
According to Reuters, exit polls show that Marine Le Pen's far-right party, the National Rally (RN), won the first round of parliamentary elections in France on Sunday.
The financial market reacted to this with a rise in the euro's exchange rate against other currencies.
Specifically, the EUR/USD rate jumped to its highest level since June 13.
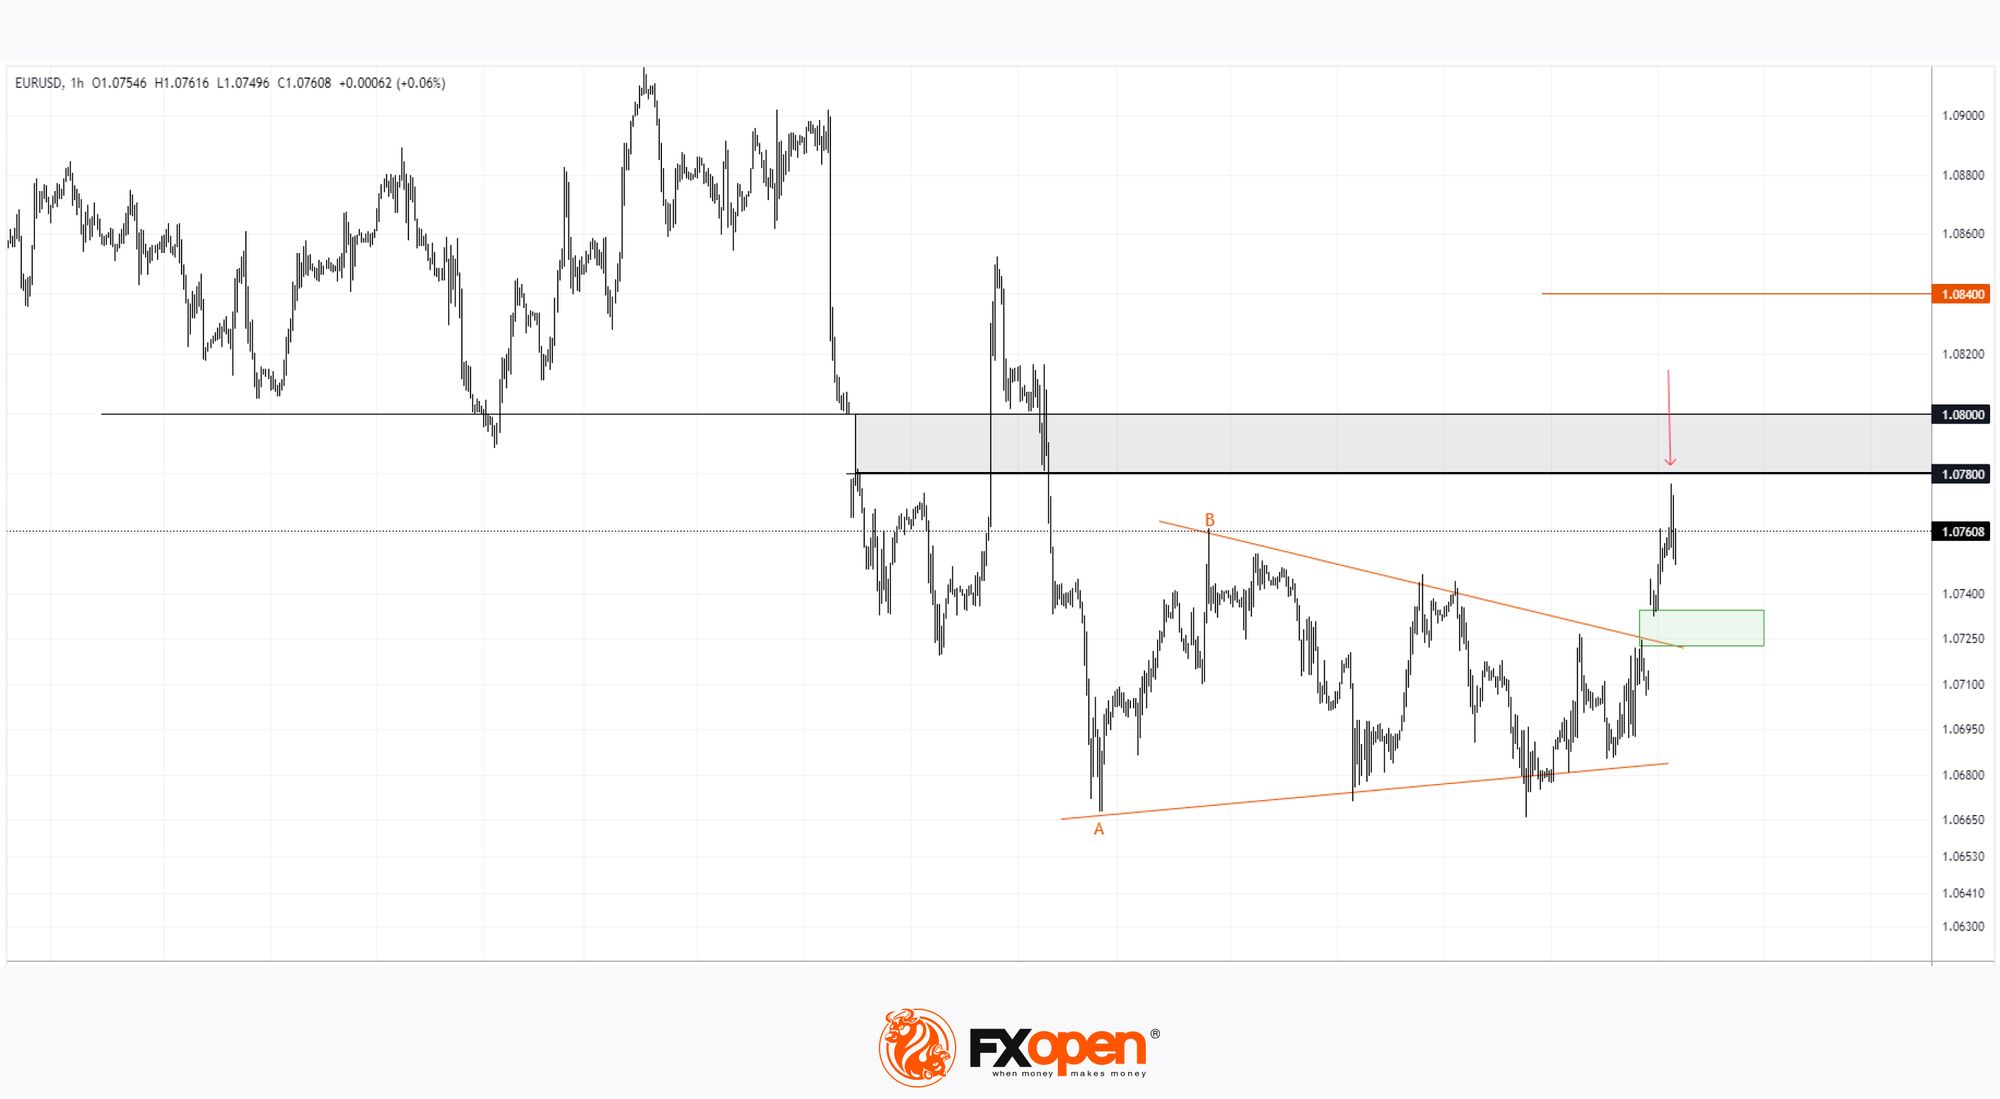
The EUR/USD chart shows that:
→ At the end of June, the price formed a consolidation pattern (shown as an orange triangle);
→ But today's bullish gap (shown in green) broke through it.
According to the principles of technical analysis, if the height of the consolidation pattern is measured through the A-B extremes, the rise could reach the level of 1.08400 (the height of the pattern, projected from the breakout level).
However, for this to happen, bulls need to overcome the resistance zone of 1.080-1.078.
Note that at the Monday morning high, the EUR/USD price sharply reversed downwards (indicated by an arrow). This indicates the activity of supply forces, so traders should not rule out a scenario where the price retraces to the breakout level, into the zone of the bullish gap.
Read analytical EUR/USD price forecasts for 2024 and beyond.
Trade over 50 forex markets 24 hours a day with FXOpen. Take advantage of low commissions, deep liquidity, and spreads from 0.0 pips (additional fees may apply). Open your FXOpen account now or learn more about trading forex with FXOpen.
This article represents the opinion of the Companies operating under the FXOpen brand only. It is not to be construed as an offer, solicitation, or recommendation with respect to products and services provided by the Companies operating under the FXOpen brand, nor is it to be considered financial advice.
Stay ahead of the market!
Subscribe now to our mailing list and receive the latest market news and insights delivered directly to your inbox.


Latest articles

Market Analysis: GBP/USD Dips Further As EUR/GBP Regains Traction
GBP/USD failed to climb above 1.3500 and corrected some gains. EUR/GBP started a decent increase and might aim for more gains above 0.8700.
Important Takeaways for GBP/USD and EUR/GBP Analysis Today
· The British Pound


Market Insights with Gary Thomson: Oil, US Retail Sales & NFP in Focus
In this video, we’ll explore the key economic events and market trends, shaping the financial landscape. Get ready for insights into financial markets to help you navigate the week ahead. Let’s dive in!
In this episode of Market