


FTSE Index Rebounds from Near Three-Month Low
FXOpen

The chart for the British FTSE 100 index (UK 100 on FXOpen) illustrates:
→ Indicated by the red arrow: Yesterday, the index fell below the 8100 level for the first time since early August, driven by bearish sentiment in the U.S. stock market following reports from Microsoft (MSFT) and Meta Platforms (META), as we noted previously.
→ Indicated by the blue arrow: Today, the FTSE 100 is rebounding on the back of local economic data releases, including UK housing prices, which, according to Trading Economics, grew less than expected.
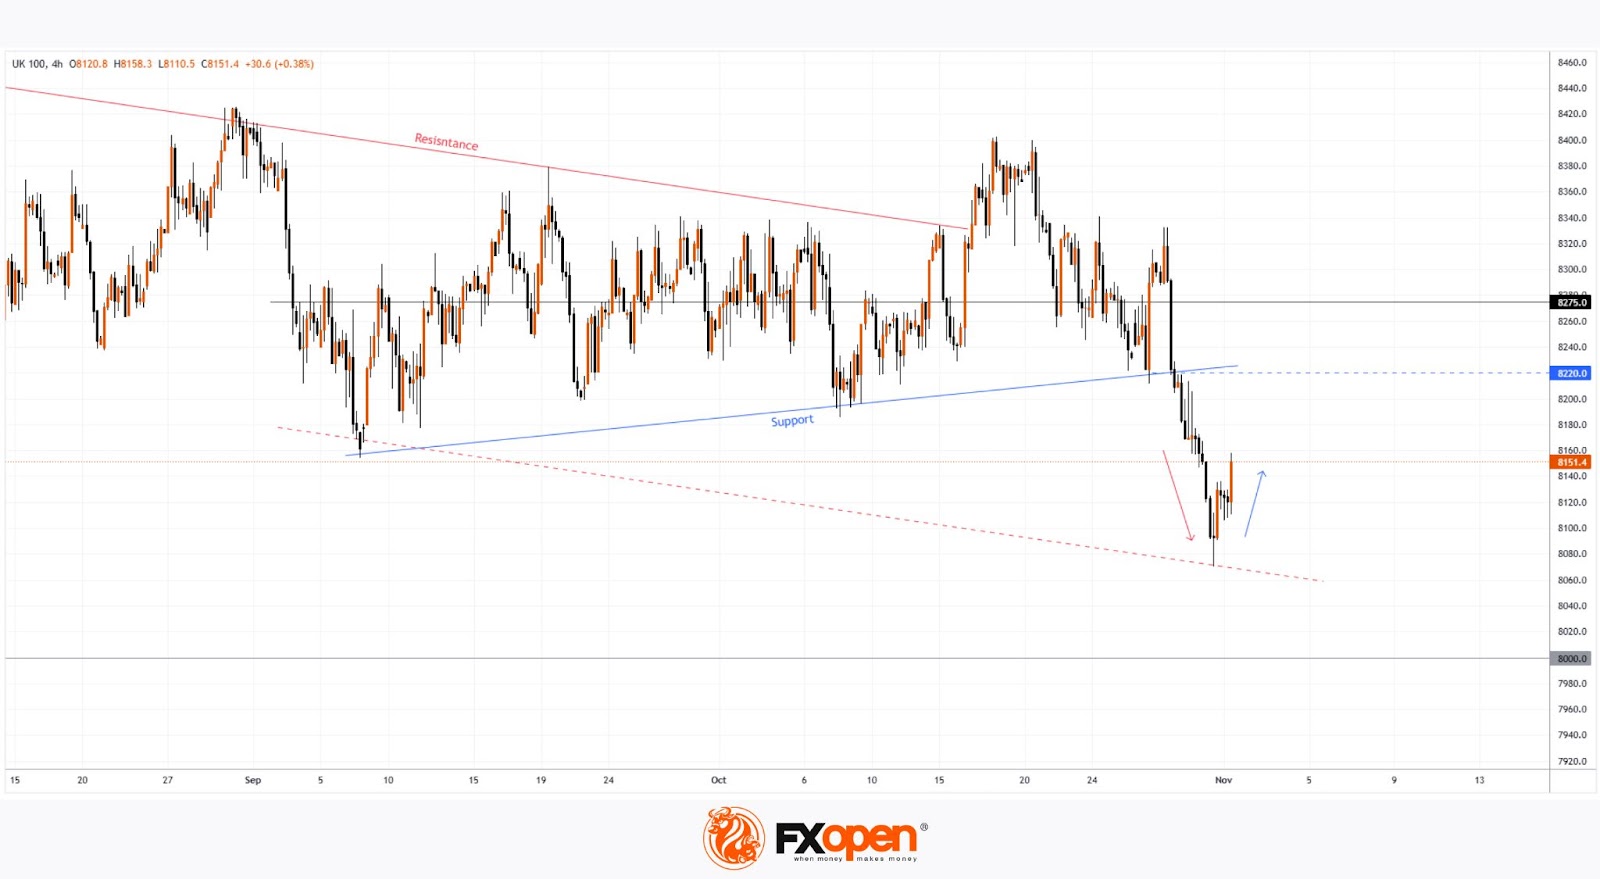
Technical analysis of the FTSE 100 (UK 100 on FXOpen) suggests that the UK stock market may be entering a downtrend, as:
→ It’s plausible that the market has been in a period of consolidation since September, forming a narrowing triangle pattern between the Support and Resistance lines.
→ An attempted bullish breakout of the Resistance line in late October failed to trigger an uptrend, while the bearish breach of the Support line appears more substantial.
→ The arrows indicate that today’s uptick may simply be a bounce from the lower boundary of a descending channel.
What’s next?
Given the correlation with the U.S. stock market, traders will likely focus on today’s key U.S. employment report due at 15:30 GMT+3, which could provide critical signals on interest rate prospects ahead of next week’s Fed meeting.
As long as the FTSE 100 index price (UK 100 on FXOpen) remains below the 8220 breakout level for the Support line, it appears the bears retain greater control.
Trade global index CFDs with zero commission and tight spreads (additional fees may apply). Open your FXOpen account now or learn more about trading index CFDs with FXOpen.
This article represents the opinion of the Companies operating under the FXOpen brand only. It is not to be construed as an offer, solicitation, or recommendation with respect to products and services provided by the Companies operating under the FXOpen brand, nor is it to be considered financial advice.
Stay ahead of the market!
Subscribe now to our mailing list and receive the latest market news and insights delivered directly to your inbox.


Latest articles

AUD/CAD: Months of Indecision — Is a Breakout Finally Coming?
The Australian dollar has clawed back most of its end-of-June losses, when it touched three-month lows against the greenback amid escalating Middle East tensions. Since then, sentiment has improved: the RBA's Assistant Governor Sarah Hunter signalled the board stands ready

USD/JPY: Battling at the Top of the Triangle
On 3 July, Japan's Finance Minister, Satsuki Katayama, stated that the Ministry of Finance remains in close contact with US authorities regarding developments in USD/JPY as the yen traded near its weakest level in almost 40 years. Similar verbal

Dow Jones (DJIA): Consolidation Beyond the Trend
Federal Reserve Chair Kevin Warsh testified before Congress on 14–15 July, reaffirming the Fed's commitment to bringing inflation back to target while providing no clear guidance on the future path of interest rates. Meanwhile, June inflation data came in