


FXOpen

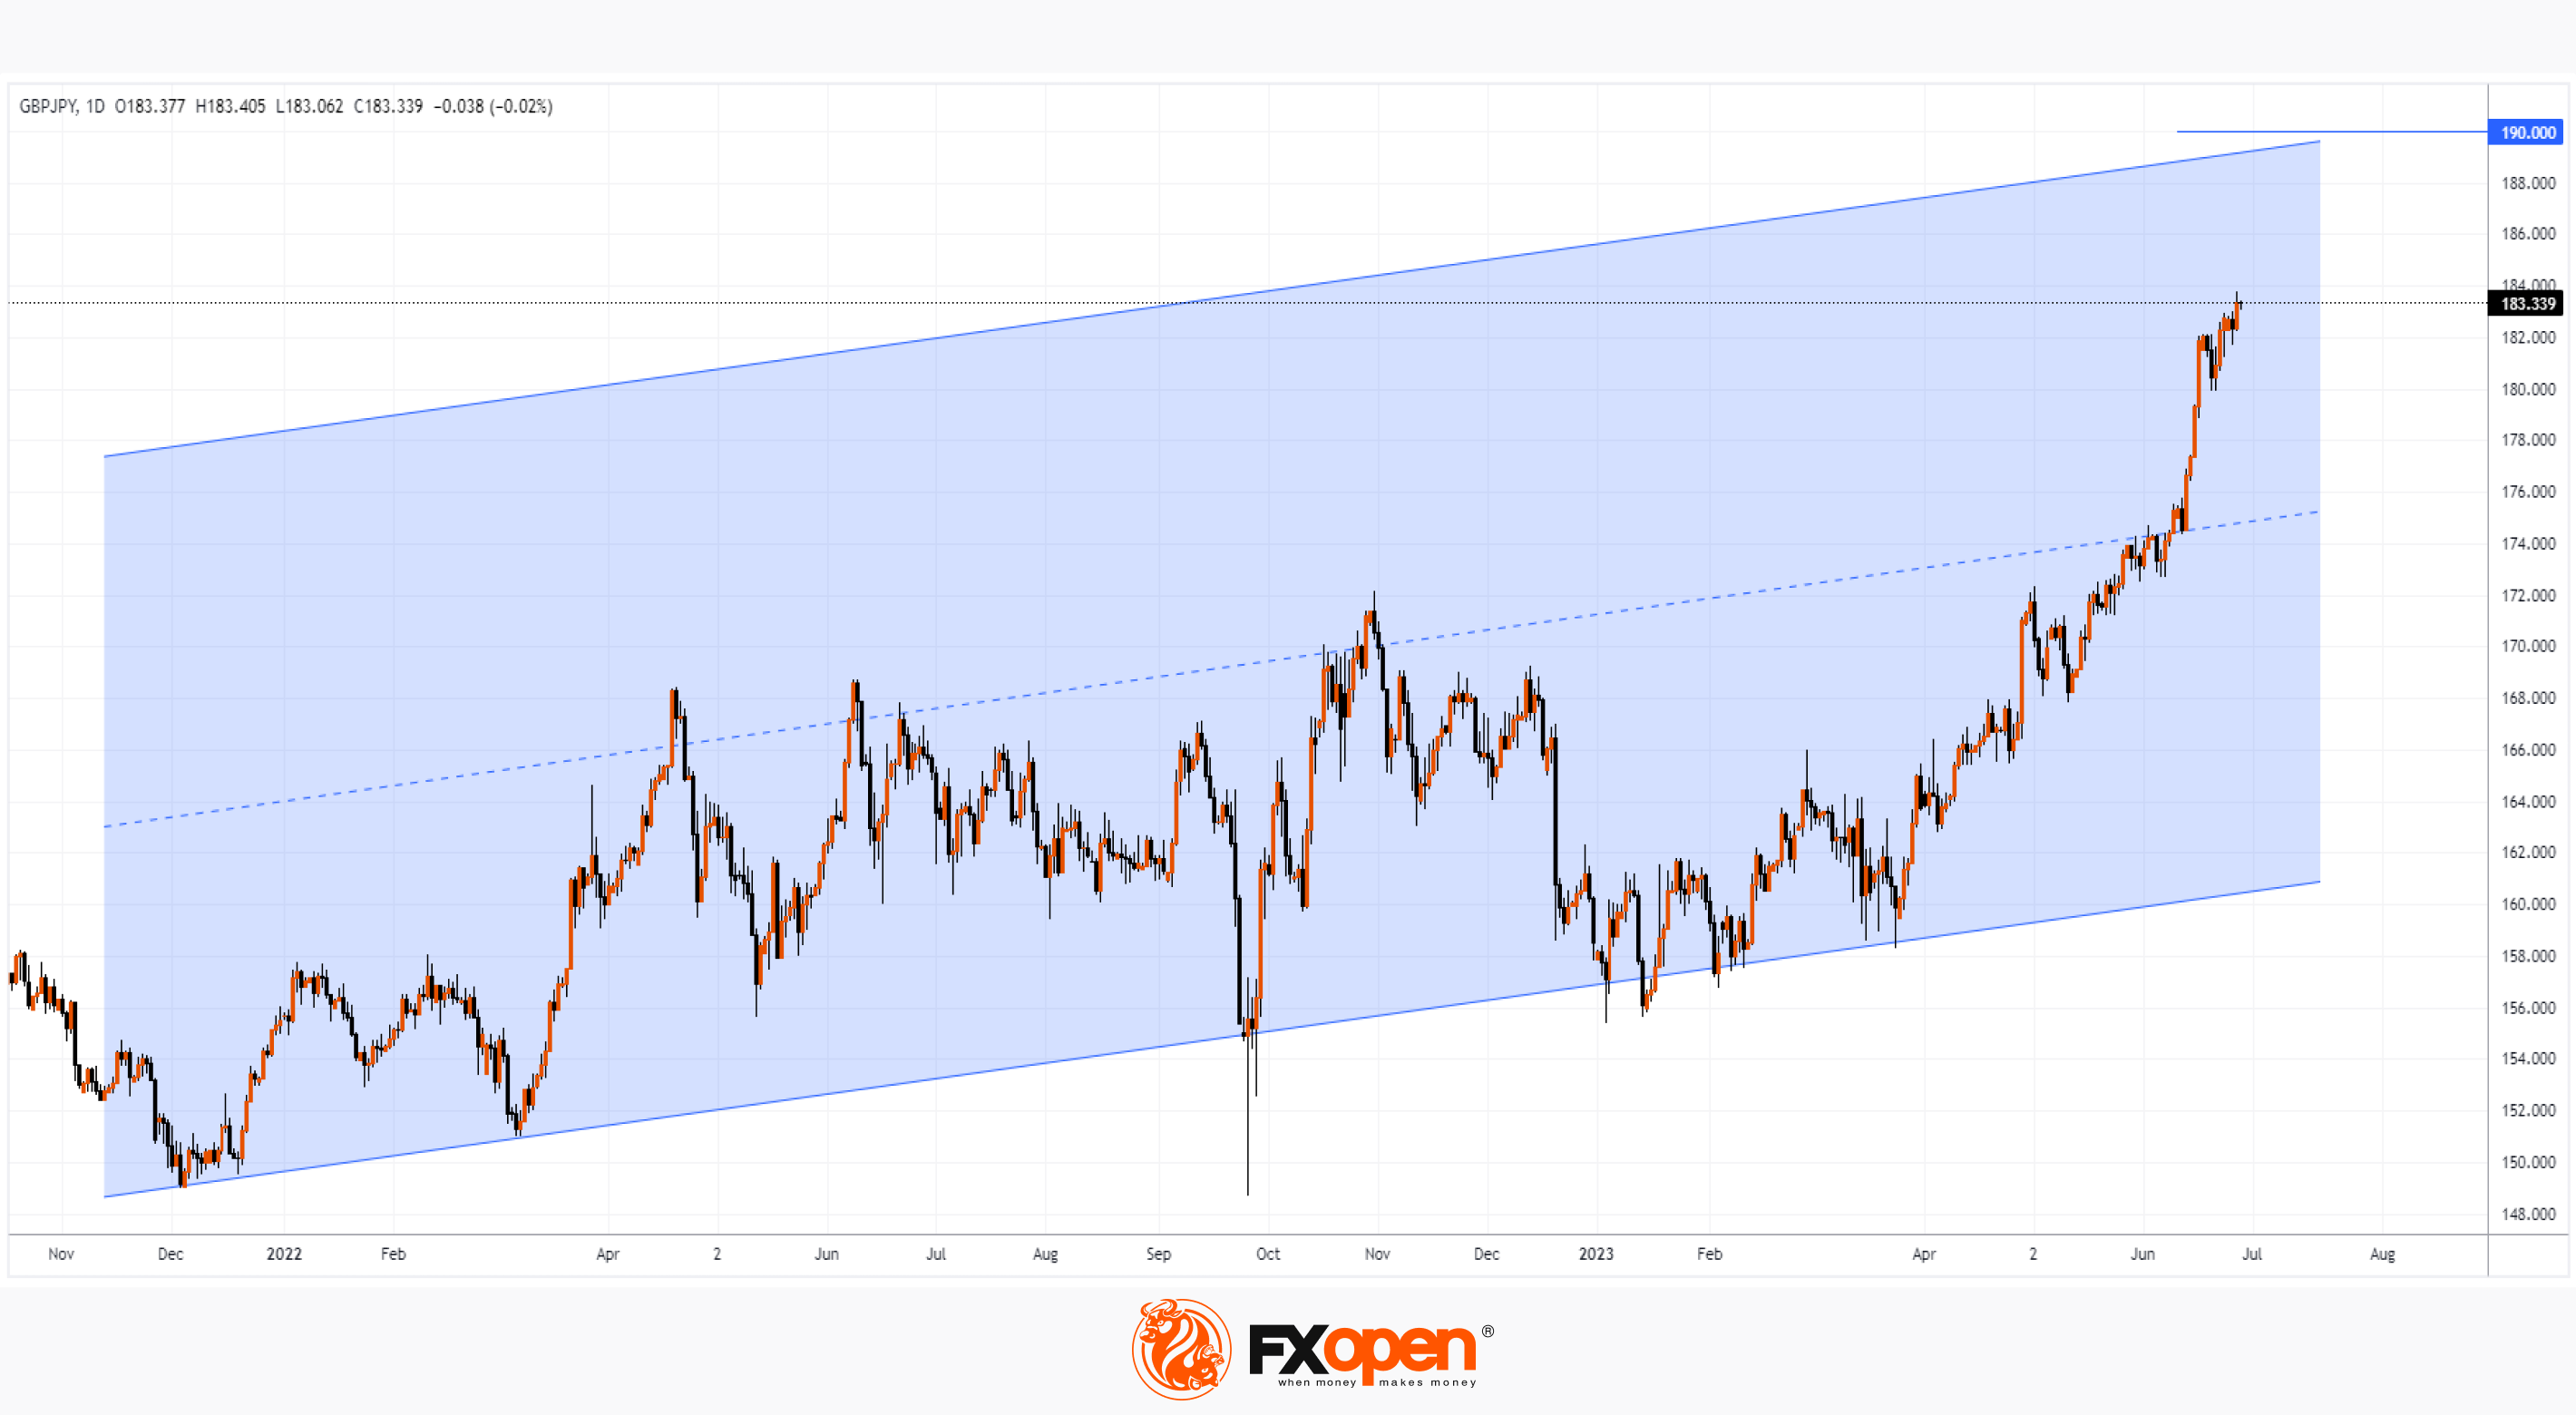
The GBP/JPY chart shows that this currency pair is in an uptrend (nearly +17% YTD) which can be explained by differences in economies. While the UK is fighting a rate hike against inflation (which has shown double digits), Japan continues to pursue an ultra-soft monetary policy.
Technically, the bulls still have a chance to reach the upper boundary of the channel (shown in blue), where the psychological resistance level of 190 yen per pound passes, but the situation may change:
→ First, the Japanese authorities are concerned. “We closely monitor the movement of the currency. We will respond appropriately if it becomes excessive,” Vice Finance Minister and Chief Currency Strategist Masato Kanda said today. Recall that the Bank of Japan has already taken interventions in the foreign exchange market to support the yen in September and October last year — and this has yielded results.
→ Secondly, the bullish momentum for the pound may weaken. Bank of America analysts' forecast for the pound is one of the most pessimistic among the G10. In their opinion, the fight against inflation in the UK will be the strongest, and the risk of a hard landing has increased.
(!) Please note that today at 16:30 GMT+3 speeches of the heads of central banks, including those of Japan and Great Britain, are scheduled. Get ready for a surge in volatility.
Trade over 50 forex markets 24 hours a day with FXOpen. Take advantage of low commissions, deep liquidity, and spreads from 0.0 pips (additional fees may apply). Open your FXOpen account now or learn more about trading forex with FXOpen.
This article represents the opinion of the Companies operating under the FXOpen brand only. It is not to be construed as an offer, solicitation, or recommendation with respect to products and services provided by the Companies operating under the FXOpen brand, nor is it to be considered financial advice.
Stay ahead of the market!
Subscribe now to our mailing list and receive the latest market news and insights delivered directly to your inbox.


Latest articles

Consolidation Ahead of NFP: Commodity Currencies Search for Direction
Commodity-linked currencies have entered a consolidation phase following recent directional moves, as market participants adopt a wait-and-see approach ahead of key US labour market data. Current price action reflects a balance between ongoing demand for the US dollar and attempts

The Real Driver Behind the Dollar Rally: Market Insights with Gary Thomson
The US dollar has been firm, but the drivers behind the move may be more complex than they first appear.
While geopolitical tension and shifts in risk sentiment play a role, current price behaviour seems increasingly influenced by inflation expectations

EUR/USD and USD/CHF Pull Back: Market Reacts to Fundamentals
European currencies have shown a recovery in recent trading sessions after their recent decline, displaying early signs of a reversal. The US dollar is weakening amid expectations surrounding upcoming US macroeconomic data, while market participants are reassessing their short-term positions