


FXOpen

As shown by today's GBP/JPY chart, the exchange rate has not only surpassed the psychological level of 200 yen per pound but has also exceeded the peak of 29 April 2024. The market is now experiencing prices last seen in 2008.
The main driver of the pound’s strength against the yen is the difference in monetary policies enacted by the central banks. While the Bank of England maintains a rate of 5.5%, in Japan it is 0.10% (having been kept unchanged at -0.10% from January 2016 until March 2024 – over 8 years).
Can the GBP/JPY rate go even higher? Fundamentally, if the imbalance in interest rates persists, it creates conditions for a continued rally.
According to Business Recorder, the Bank of Japan (BOJ) will act cautiously within its inflation targeting framework. BOJ Governor Kazuo Ueda noted that some issues are "exceptionally challenging" for Japan after many years of ultra-loose monetary policy.
“The absence of significant interest rate movements poses a considerable obstacle in assessing the economy’s response to changes in interest rates,” he said.
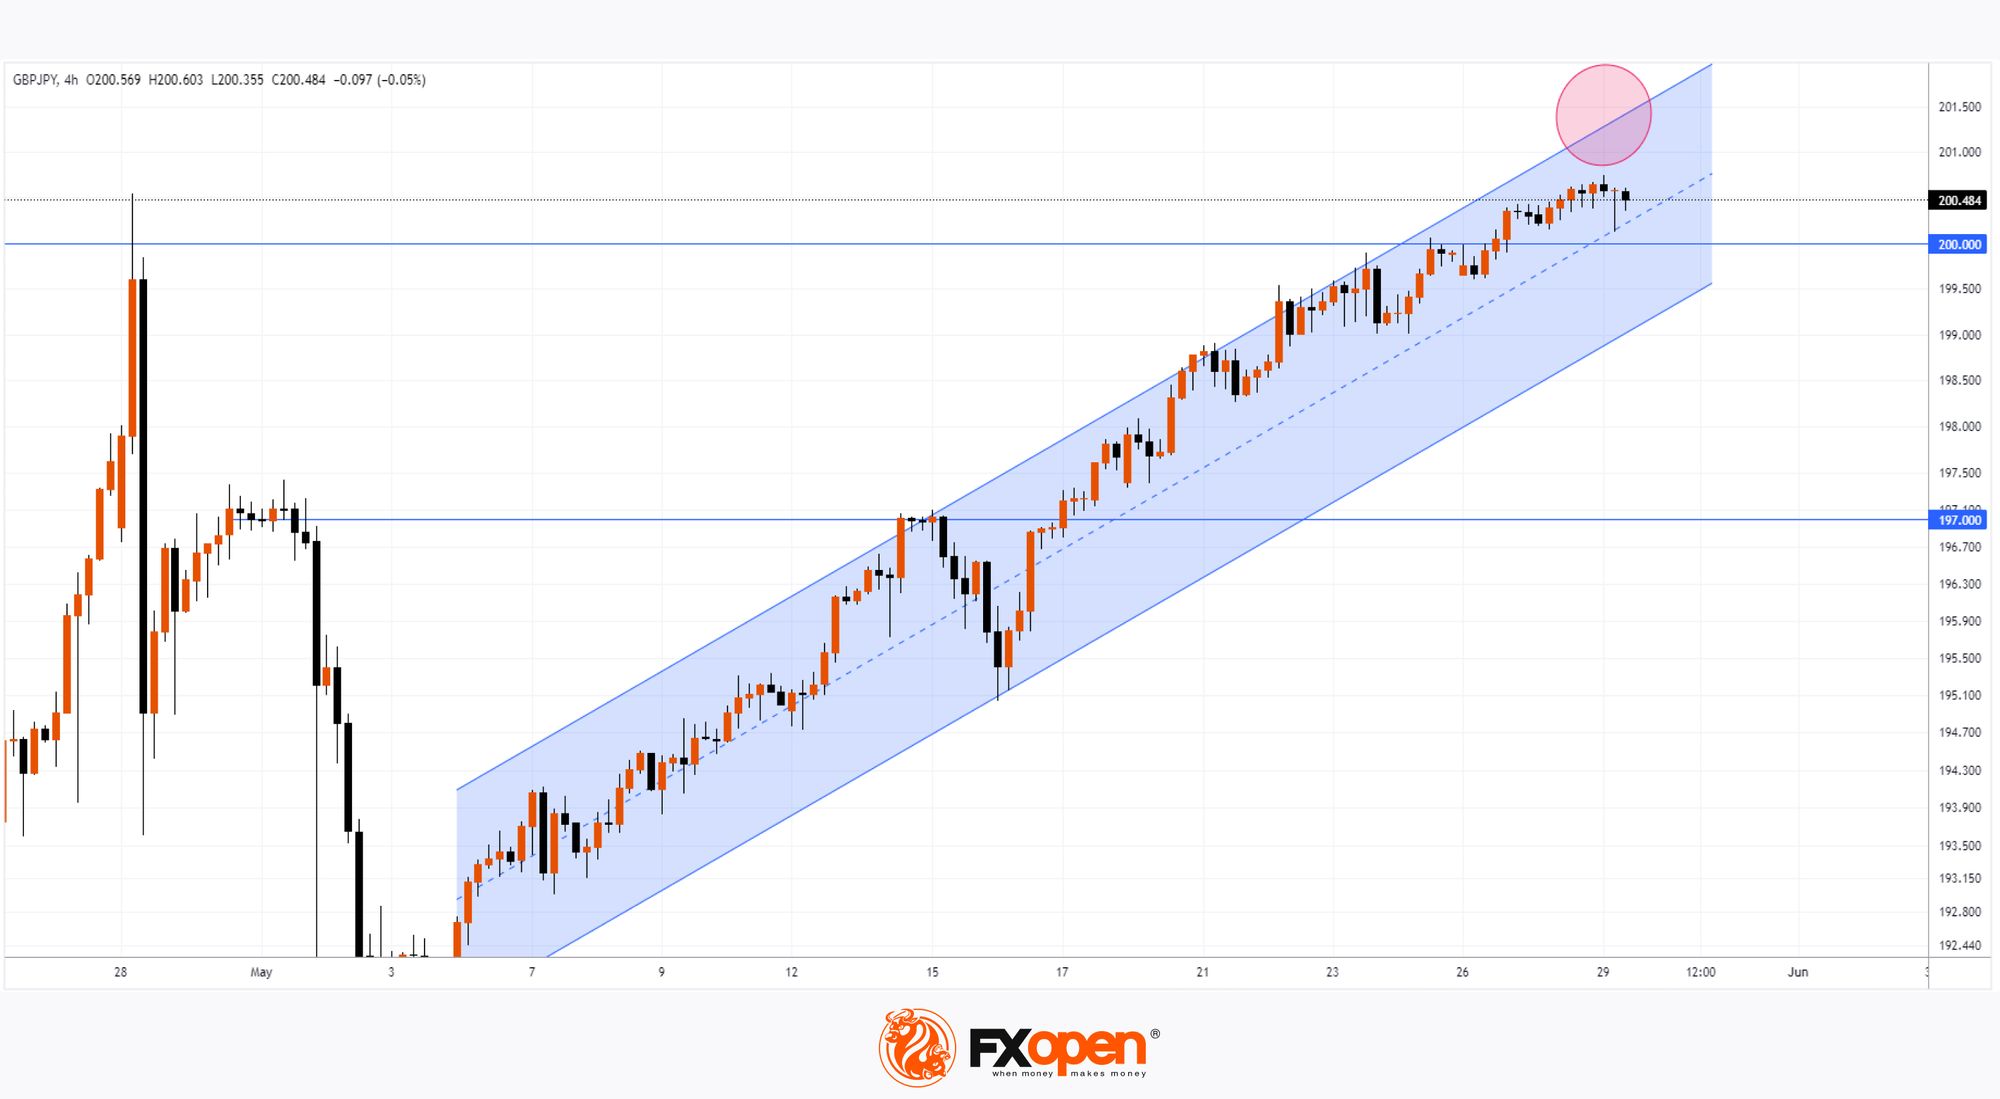
Technical analysis of the GBP/JPY pair on the 4-hour chart today indicates that the price is in an uptrend (shown by the blue channel). However, the 200 yen per pound level is showing signs of resistance:
→ It is a psychological “round” number.
→ In April, the Bank of Japan intervened at this level to support the excessively weak yen, which might make buyers act more cautiously.
→ An analysis of the chart shows that the bulls have been unable to push the price to the upper boundary of the ascending channel (shown by the red circle). This is a bearish sign, which can be interpreted as a weakening bullish impulse after surpassing the psychological level.
If the GBP/JPY price can hold above the 200 yen per pound level, it will increase the likelihood that the May uptrend channel will remain valid.
Trade over 50 forex markets 24 hours a day with FXOpen. Take advantage of low commissions, deep liquidity, and spreads from 0.0 pips (additional fees may apply). Open your FXOpen account now or learn more about trading forex with FXOpen.
This article represents the opinion of the Companies operating under the FXOpen brand only. It is not to be construed as an offer, solicitation, or recommendation with respect to products and services provided by the Companies operating under the FXOpen brand, nor is it to be considered financial advice.
Stay ahead of the market!
Subscribe now to our mailing list and receive the latest market news and insights delivered directly to your inbox.


Latest articles

Market Analysis: GBP/USD Dips Further As EUR/GBP Regains Traction
GBP/USD failed to climb above 1.3500 and corrected some gains. EUR/GBP started a decent increase and might aim for more gains above 0.8700.
Important Takeaways for GBP/USD and EUR/GBP Analysis Today
· The British Pound


Market Insights with Gary Thomson: Oil, US Retail Sales & NFP in Focus
In this video, we’ll explore the key economic events and market trends, shaping the financial landscape. Get ready for insights into financial markets to help you navigate the week ahead. Let’s dive in!
In this episode of Market