


FXOpen

Yesterday, important U.S. inflation data was released, as reported by ForexFactory:
→ Core CPI (MoM): actual = 0.2%, forecast = 0.2%; previous = 0.1%;
→ CPI (YoY): actual = 2.9%, forecast = 3.0%; previous = 3.0%.
Today, market participants learned about the change in the UK’s monthly GDP: actual = 0.0%, forecast = 0.0%; previous = 0.4%.
However, these news releases had little impact on the GBP/USD exchange rate, likely because the actual figures were in line with expectations.
Today's technical analysis of the GBP/USD chart shows that the price is consolidating within a narrowing triangle (marked in green). The upper line of this triangle aligns with a fan line that has been expanding downwards, with price action tracing the fan's contours since the second half of July.
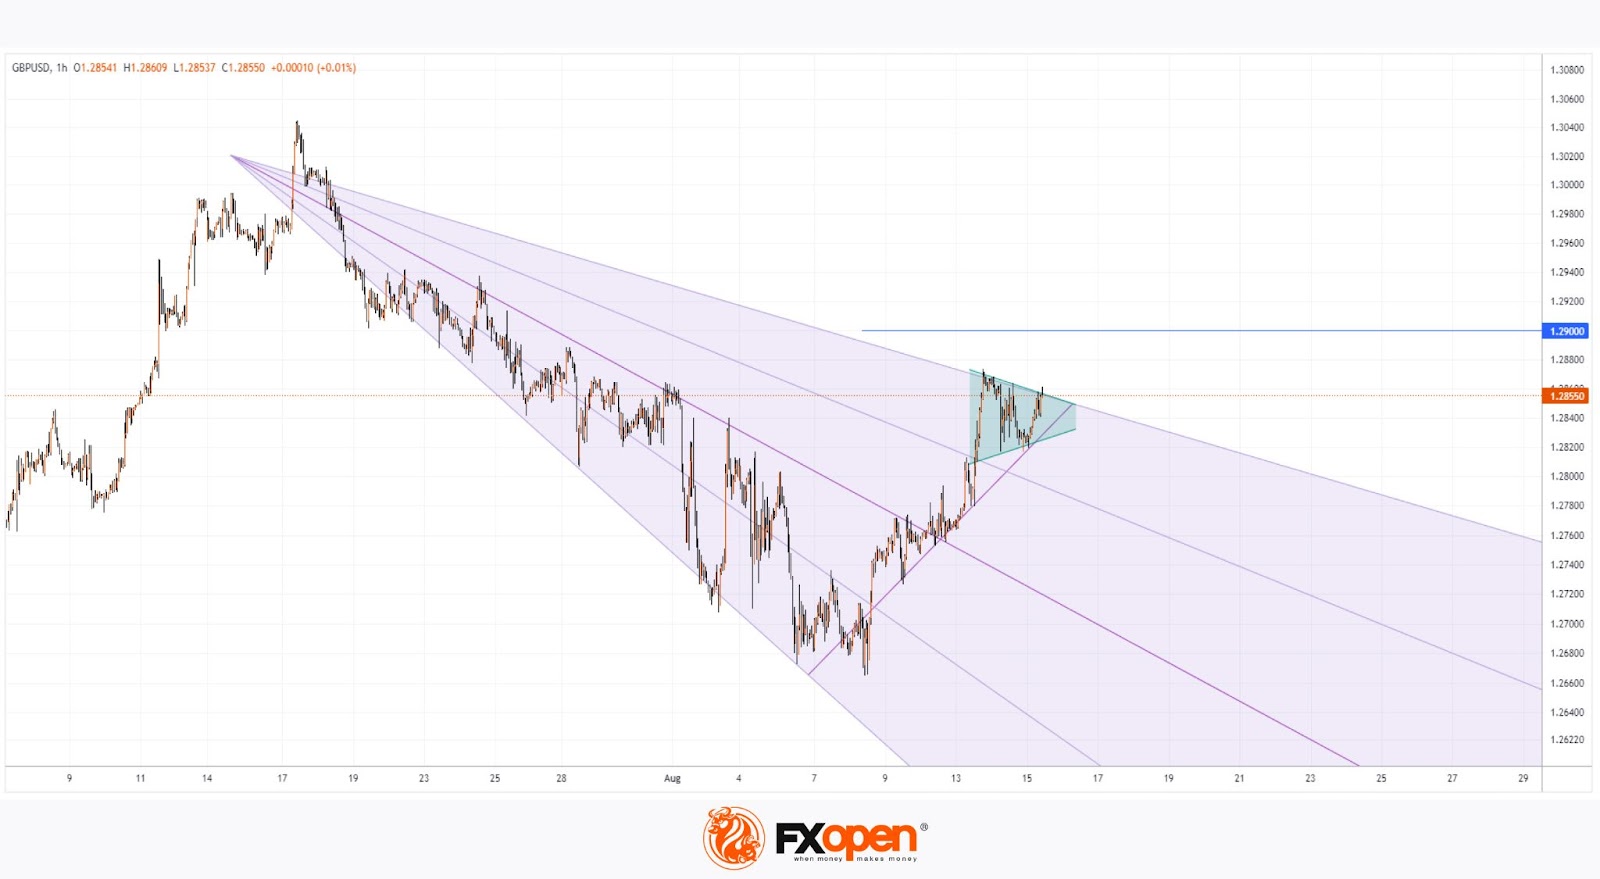
Which Way Will the Triangle Break?
If the bulls take the initiative and attempt to break upwards out of the triangle, they may quickly encounter resistance around the 1.2900 level—this is not only a round psychological number but also the 50% retracement level of the bearish impulse from the July 17 peak to the August 8 low (A→B).
Today, data on U.S. retail sales and the labour market will be released at 15:30 (GMT+3). There’s a possibility these reports could surprise the market, leading to sharp movements in GBP/USD and disrupting the current state of temporary stability.
Trade over 50 forex markets 24 hours a day with FXOpen. Take advantage of low commissions, deep liquidity, and spreads from 0.0 pips (additional fees may apply). Open your FXOpen account now or learn more about trading forex with FXOpen.
This article represents the opinion of the Companies operating under the FXOpen brand only. It is not to be construed as an offer, solicitation, or recommendation with respect to products and services provided by the Companies operating under the FXOpen brand, nor is it to be considered financial advice.
Stay ahead of the market!
Subscribe now to our mailing list and receive the latest market news and insights delivered directly to your inbox.


Latest articles

European Currencies Decline: Pound Hits New Lows, Euro Under Pressure
European currencies continue to weaken against the US dollar amid rising geopolitical tensions and increased demand for safe-haven and liquid assets. Market participants are reducing exposure to riskier instruments, putting pressure on both the euro and the pound. Additional support

Market Analysis: GBP/USD Dips Further As EUR/GBP Regains Traction
GBP/USD failed to climb above 1.3500 and corrected some gains. EUR/GBP started a decent increase and might aim for more gains above 0.8700.
Important Takeaways for GBP/USD and EUR/GBP Analysis Today
· The British Pound
