


GBP/USD Price Declining after Encouraging UK Inflation Data Release
FXOpen

After yesterday's disappointing US inflation data, market participants were wary of UK inflation data. But they turned out to be more favorable.
→ Core CPI: actual = 5.1%, expected = 5.2%, past values = 5.1%
→ CPI: actual = 4.0%, expected = 4.1%, past values = 4.0%
Although in absolute comparison the inflation rate in the UK is significantly higher than in the USA, it is encouraging that over the month it shows a downward trend.
This eases pressure on the Bank of England in its tight monetary policy, and therefore the British pound fell in value against other currencies. In particular, the decline against the USD that began yesterday continued. Since yesterday's high, the price of GBP/USD has already decreased by approximately 1%.
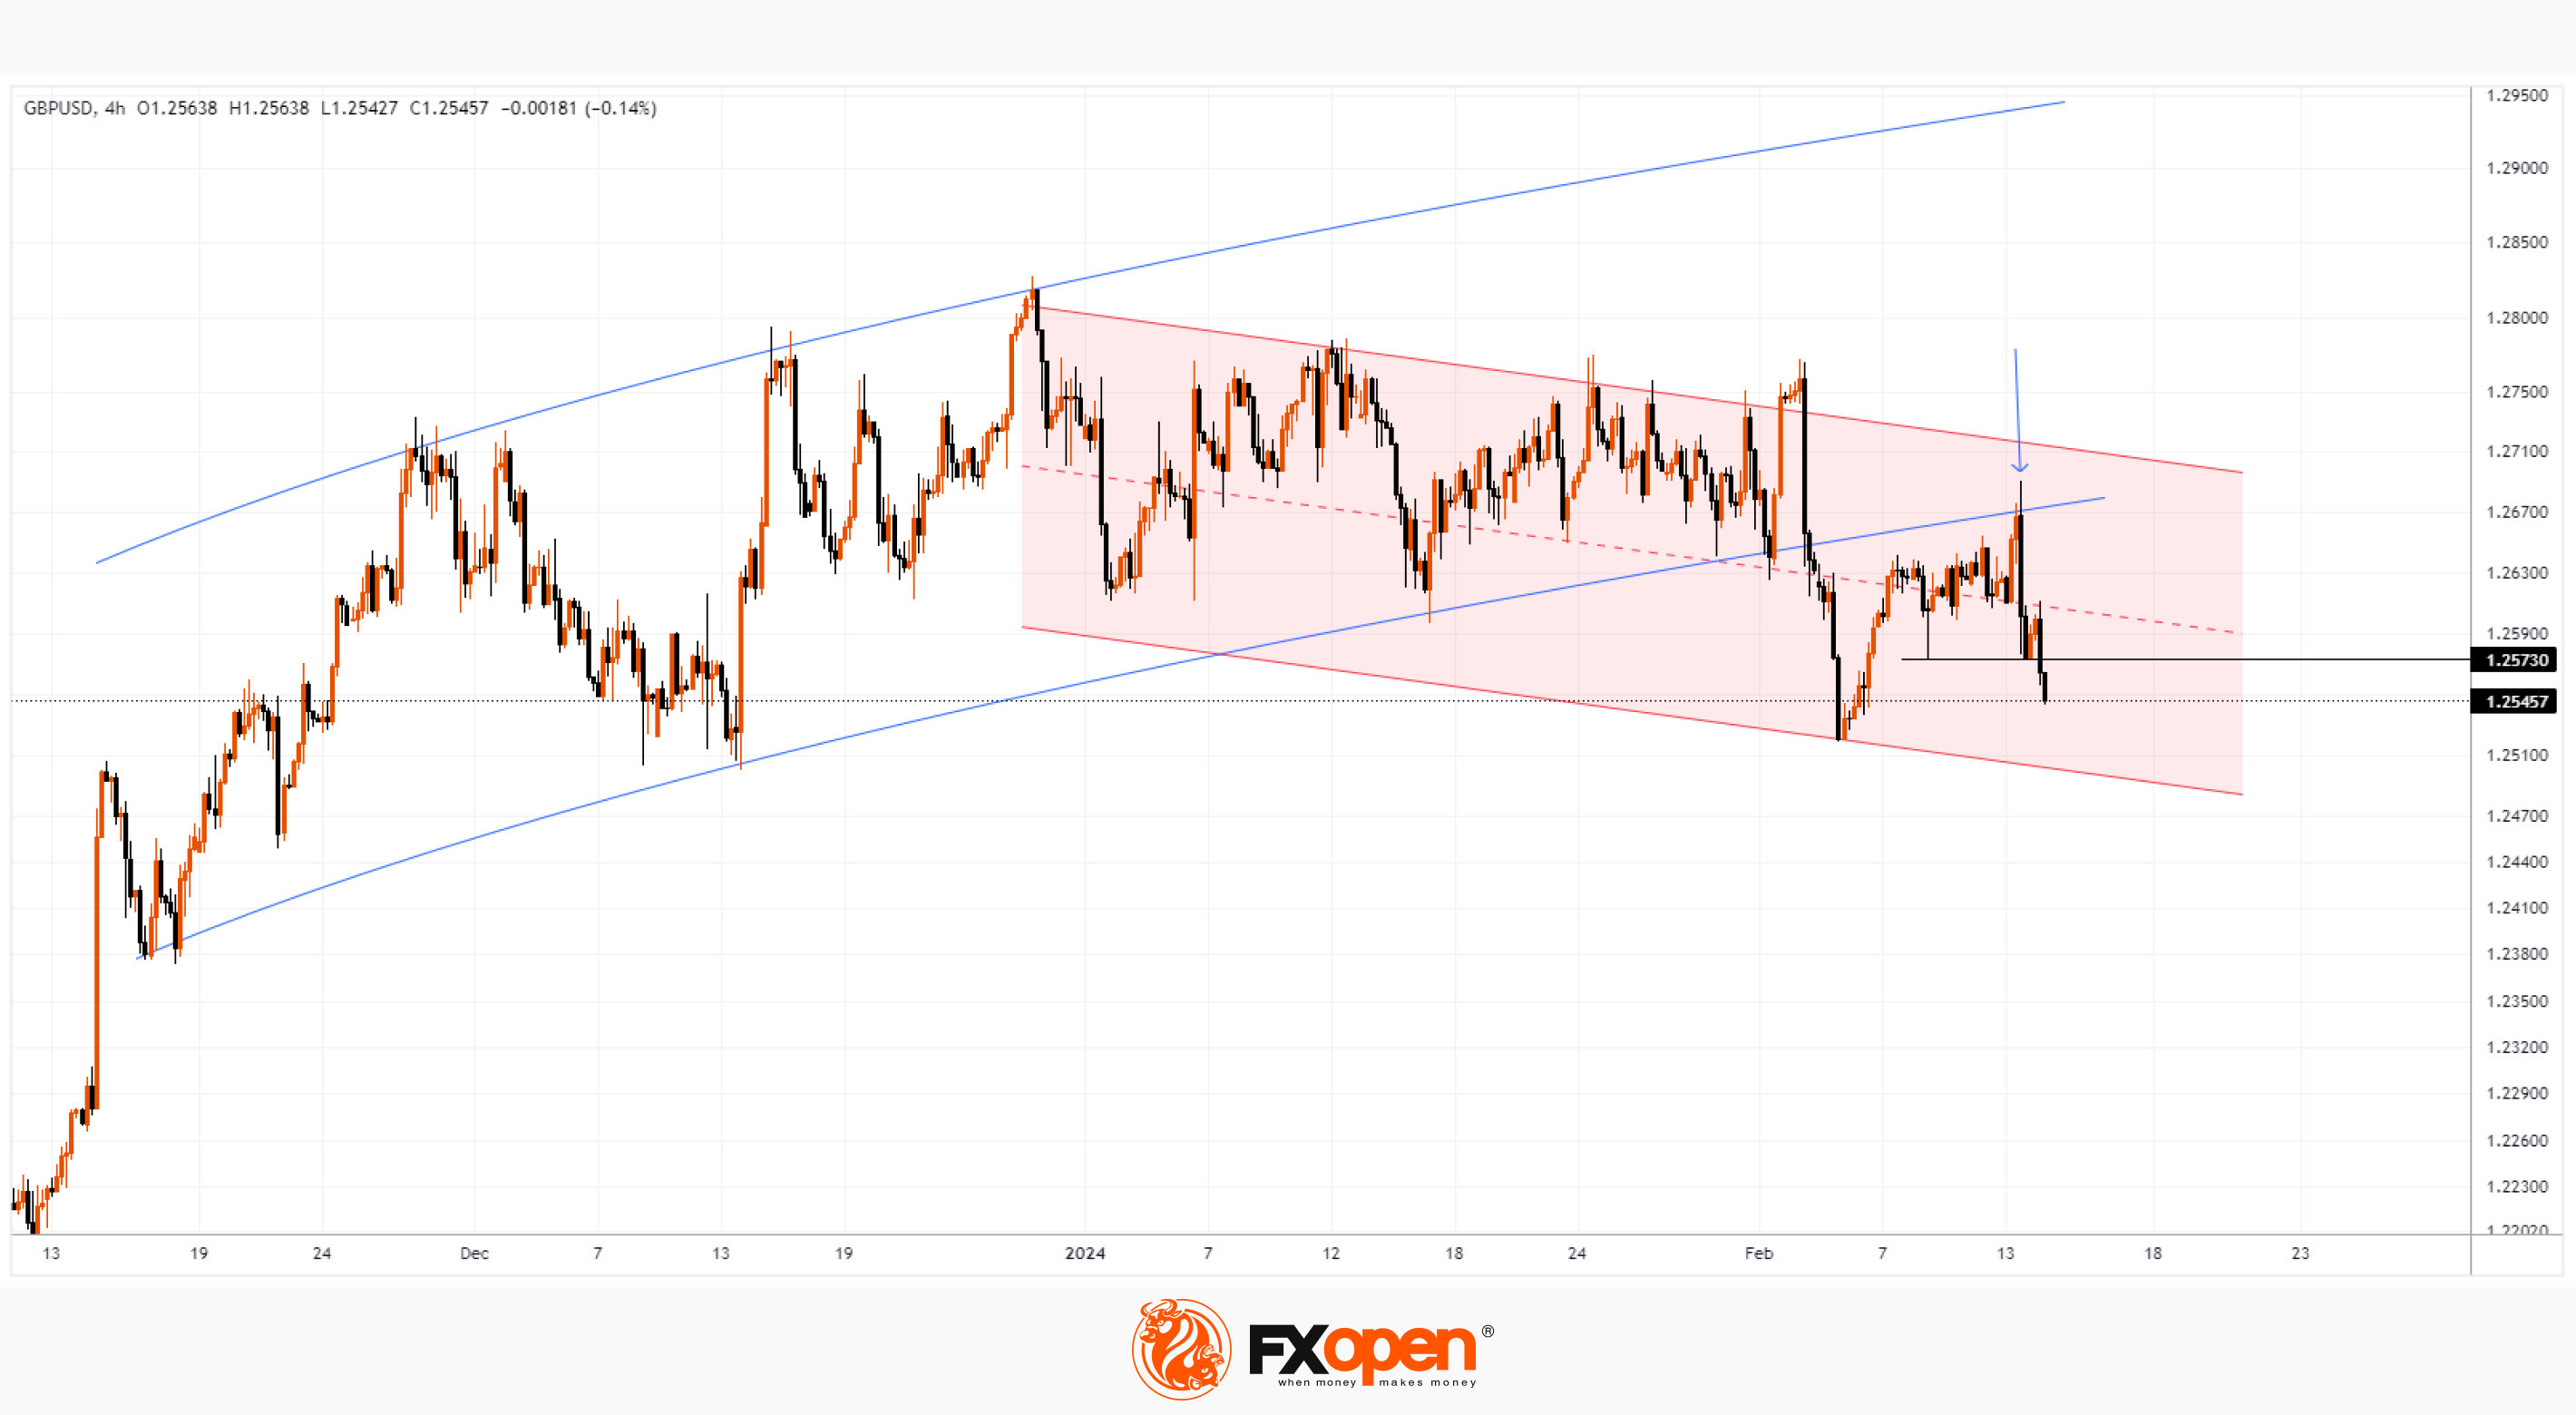
The GBP/USD chart shows that:
→ the bears have broken the upward trajectory indicated by the blue lines;
→ the price develops within the descending channel (shown in red);
→ the price dropped below the level of 1.25730, which served as support since February 8.
If the trend continues, the GBP/USD price could drop to the lower boundary of the red channel, thereby setting the 2024 low.
The following can add confidence to bears:
→ a long upper shadow was formed on yesterday’s candle (at the same time a test of the blue line occurred, as shown by the arrow);
→ based on the technical analysis of GBP/USD, it is acceptable to assume that the median line of the red channel will act as resistance.
Trade over 50 forex markets 24 hours a day with FXOpen. Take advantage of low commissions, deep liquidity, and spreads from 0.0 pips (additional fees may apply). Open your FXOpen account now or learn more about trading forex with FXOpen.
This article represents the opinion of the Companies operating under the FXOpen brand only. It is not to be construed as an offer, solicitation, or recommendation with respect to products and services provided by the Companies operating under the FXOpen brand, nor is it to be considered financial advice.
Stay ahead of the market!
Subscribe now to our mailing list and receive the latest market news and insights delivered directly to your inbox.


Latest articles

Weekly Market Insights with Gary Thomson: The Week of Central Banks and Earnings
In this video, we’ll explore the key economic events and market trends, shaping the financial landscape. Get ready for insights into financial markets to help you navigate the week ahead. Let’s dive in!
In this episode of Market

Intel at a Crossroads: Earnings Beat Meets Technical Resistance
Intel has just delivered its strongest quarter in over fifteen years, and the market reaction says it all. Q2 2026 revenue surged 25% year-over-year to $16.1 billion, crushing the consensus estimate of $14.42 billion, while adjusted EPS of

Tesla: Complex Range Structure Breaks Down Following Quarterly Earnings
Tesla released its Q2 2026 results after the market closed on 22 July. Revenue increased 26% year-on-year to $28.24 billion, while vehicle deliveries reached a record 480,126 units. However, operating margin fell sharply to 1.4%, down from