


FXOpen

At the market open on Monday, 5 January, gold price (XAU/USD) formed a bullish gap. The sharp rise was driven by market reaction to confirmed reports of U.S. military intervention in Venezuela and a forced change of power in Caracas.
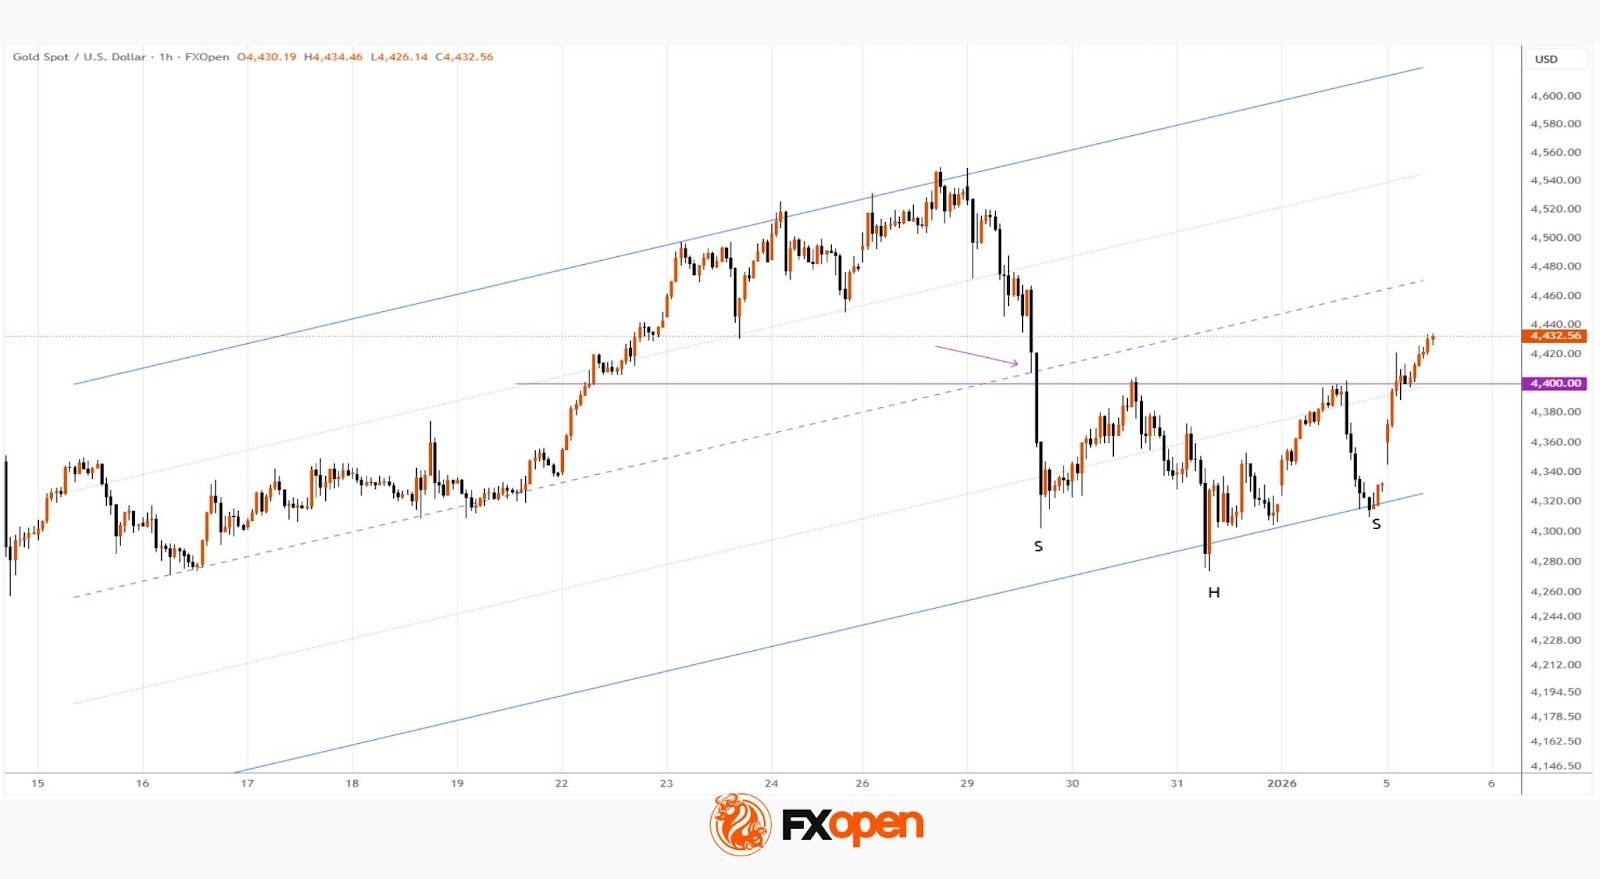
News of the capture of Nicolás Maduro by U.S. special forces pushed gold prices up to $4,430 during the European session, and the upward trend may persist into the U.S. trading session. The chart indicates rising demand for safe-haven assets, as market participants may be concerned about further escalation.
Technical Analysis of the XAU/USD Chart
On 26 December, when analysing the gold chart, we:
→ identified an ascending channel;
→ highlighted the $4,400 level;
→ suggested a scenario of bullish momentum exhaustion and profit-taking on long positions, which could lead to a pullback.
Indeed, since then a significant correction has developed, during which:
→ the price (marked by an arrow) expanded the ascending channel to the downside (its former lower boundary became the median line);
→ the $4,400 level acted as resistance on 30 December and 2 January.
However, the geopolitical drivers described above contributed to the following:
→ bulls used the lower boundary of the expanded channel as support to resume the upward move (with a bullish Inverse Head and Shoulders pattern forming on the chart);
→ the $4,400 resistance level was broken and may now act as support.
In the short term, it cannot be ruled out that the XAU/USD price may rise towards the median of the indicated channel.
Start trading commodity CFDs with tight spreads (additional fees may apply). Open your trading account now or learn more about trading commodity CFDs with FXOpen.
This article represents the opinion of the Companies operating under the FXOpen brand only. It is not to be construed as an offer, solicitation, or recommendation with respect to products and services provided by the Companies operating under the FXOpen brand, nor is it to be considered financial advice.
Stay ahead of the market!
Subscribe now to our mailing list and receive the latest market news and insights delivered directly to your inbox.


Latest articles

USD/CAD Rises to a Two-Month High
Today, the USD/CAD currency pair climbed above the 1.3787 level for the first time since late January.
→ Demand for the US dollar is being supported by concerns over escalating tensions in the Middle East. Market participants are favouring

Alphabet (GOOGL) Shares Fall to 2026 Low
As the chart shows, Alphabet (GOOGL) shares have dropped to their lowest level of 2026, with trading closing well below the psychological $300 per share mark.
Why Have Alphabet (GOOGL) Shares Declined?
The bearish move is driven by a combination

FX Market Awaits Macro Data: EUR/USD and GBP/USD Near Range Boundaries
European currencies are trading without a clear direction against the US dollar, remaining in a consolidation phase following the earlier decline driven by USD strength. At the start of the week, both EUR/USD and GBP/USD attempted a recovery,