


Gold Price Analysis: Price Retreats From Record Highs
FXOpen

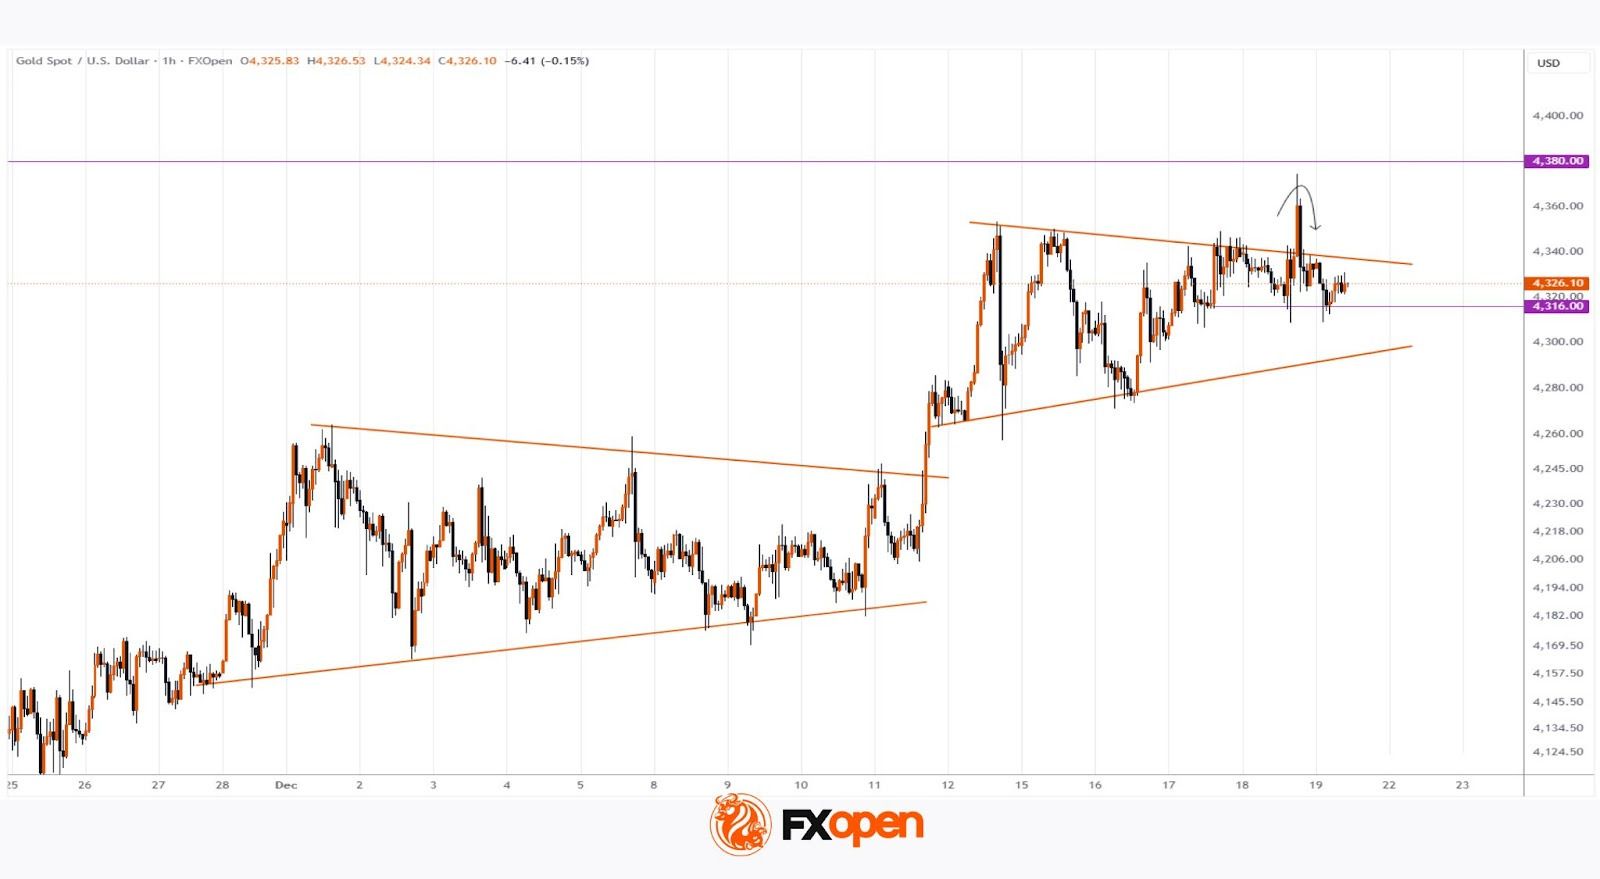
As the XAU/USD chart shows, gold rallied yesterday to near its October all-time high around the 4,380 level, before pulling back (as indicated by the arrow).
The surge in volatility was driven by a combination of factors:
→ Expectations of US rate cuts. According to media reports, data released yesterday showed that inflation slowed to 2.7% in November, below the 3.1% forecast, while core CPI eased to 2.6%, the lowest reading since March 2021. Markets are currently pricing in roughly a 25% chance of a rate cut in January, with a cut by April seen as almost certain.
→ Geopolitical tensions. Traders are closely monitoring developments linked to Venezuela, where the risk of an armed conflict involving the United States has increased. Market participants also reacted to statements from UK and European politicians ahead of the EU summit.
On 5 December, we:
→ noted that the lack of a clear trend had resulted in the formation of a symmetrical triangle, with its midline around $4,205;
→ suggested that this pattern on the XAU/USD chart could act like a “compressed spring”, eventually leading to a volatility breakout.
Such a volatility surge materialised on 11–12 December, when gold broke out of the triangle and posted a high near $4,340.
Since then, a new triangle has begun to form, with a central axis around $4,316, reflecting a developing balance between supply and demand. In this context, it is worth highlighting that:
→ yesterday’s rally and subsequent reversal can be interpreted as a false bullish breakout, signalling strong selling pressure near the record high and suggesting that gold may retreat towards the lower boundary of the emerging triangle;
→ the approaching holiday period is typically associated with thinner market liquidity, which often amplifies price swings. In such conditions, gold could still surprise traders with another push to fresh record highs.
Start trading commodity CFDs with tight spreads (additional fees may apply). Open your trading account now or learn more about trading commodity CFDs with FXOpen.
This article represents the opinion of the Companies operating under the FXOpen brand only. It is not to be construed as an offer, solicitation, or recommendation with respect to products and services provided by the Companies operating under the FXOpen brand, nor is it to be considered financial advice.
Stay ahead of the market!
Subscribe now to our mailing list and receive the latest market news and insights delivered directly to your inbox.


Latest articles

GBP/USD and EUR/GBP Await Key Bank of England Decision
The pound strengthened following the outcome of the US Federal Reserve meeting, where the central bank, as expected, kept interest rates unchanged. However, the Fed did not provide the market with clear signals of an imminent shift towards rate cuts,

Microsoft Analysis: Earnings Beat Expectations
On 29 July 2026, Microsoft reported its results for the fourth quarter of fiscal year 2026. Revenue reached $90 billion, up 18% year-on-year, while adjusted earnings per share came in at $4.74, comfortably ahead of analysts' expectations of $4.

EUR/USD: All Eyes on the Fed as the Range Reaches Its Breaking Point
The dollar's next move hinges on tonight's Fed decision, and this time markets genuinely don't know what to expect. While economists still lean toward a hold—with CME FedWatch odds sitting near 68.5% for no change—Kevin Warsh's hawkish