


FXOpen

The XAU/USD chart shows:
→ A notable peak in November near the $2716 level (indicated by the first arrow);
→ Yesterday, gold surpassed this peak, reaching a new one-month high.
Factors Supporting Bullish Sentiment
→ Yesterday’s US Consumer Price Index data met analysts’ expectations. This bolstered market speculation about a Federal Reserve interest rate cut in December, enhancing the appeal of non-yielding assets like gold.
→ Geopolitical tensions in Eastern Europe and the Middle East, along with uncertainty surrounding the policy direction and tariff plans of newly elected US President Donald Trump, are contributing to gold’s safe-haven appeal.
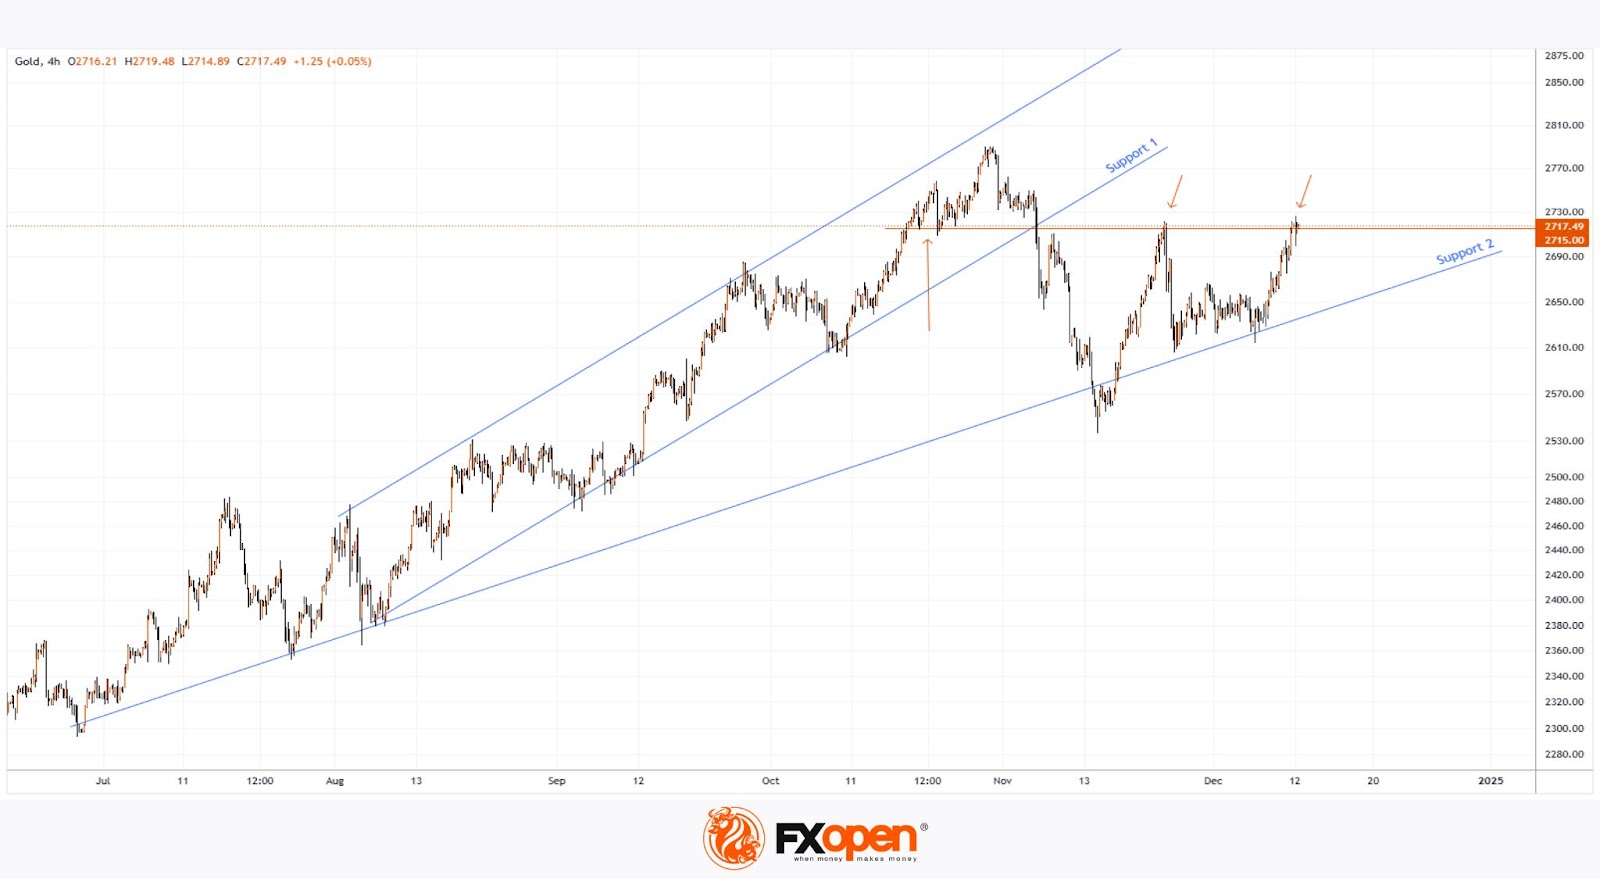
Technical Analysis of XAU/USD
Gold prices have been rising since August within a channel, with the lower boundary marked as Support 1. However, in November, Support 2—a line with a gentler slope—gained relevance, potentially signalling waning demand strength.
If buyers are indeed losing momentum, a price reversal from the fresh high could occur. This would suggest a false bullish breakout above the mid-November peak near $2715. Early trading action on the XAU/USD chart this morning lends weight to this potential scenario.
Start trading commodity CFDs with tight spreads (additional fees may apply). Open your trading account now or learn more about trading commodity CFDs with FXOpen.
This article represents the opinion of the Companies operating under the FXOpen brand only. It is not to be construed as an offer, solicitation, or recommendation with respect to products and services provided by the Companies operating under the FXOpen brand, nor is it to be considered financial advice.
Stay ahead of the market!
Subscribe now to our mailing list and receive the latest market news and insights delivered directly to your inbox.


Latest articles

Market Analysis: GBP/USD Dips Further As EUR/GBP Regains Traction
GBP/USD failed to climb above 1.3500 and corrected some gains. EUR/GBP started a decent increase and might aim for more gains above 0.8700.
Important Takeaways for GBP/USD and EUR/GBP Analysis Today
· The British Pound


Market Insights with Gary Thomson: Oil, US Retail Sales & NFP in Focus
In this video, we’ll explore the key economic events and market trends, shaping the financial landscape. Get ready for insights into financial markets to help you navigate the week ahead. Let’s dive in!
In this episode of Market