


FXOpen

Yesterday, Alphabet released its Q2 report:
→ Earnings per share: actual = $1.89, forecast = $1.847;
→ Gross revenue: actual = $84.742 billion, forecast = $84.208 billion.
The actual figures exceeded analysts' expectations. However, today in pre-market trading, GOOGL's price fluctuates around $178.60 per share, down from $183.60 at yesterday's close. Investors might be disappointed by YouTube's ad sales growth falling short of expectations ($8.7 billion versus the projected $8.9 billion).
It appears that GOOGL shares will join other tech companies whose stocks are losing ground in the stock market.
On 18th July, analysing NVDA's chart, we noted that the bears had the initiative. On 19th July, we pointed out bearish signs on META's stock charts. And on 22nd July, we highlighted bearish signs on MSFT's price chart.
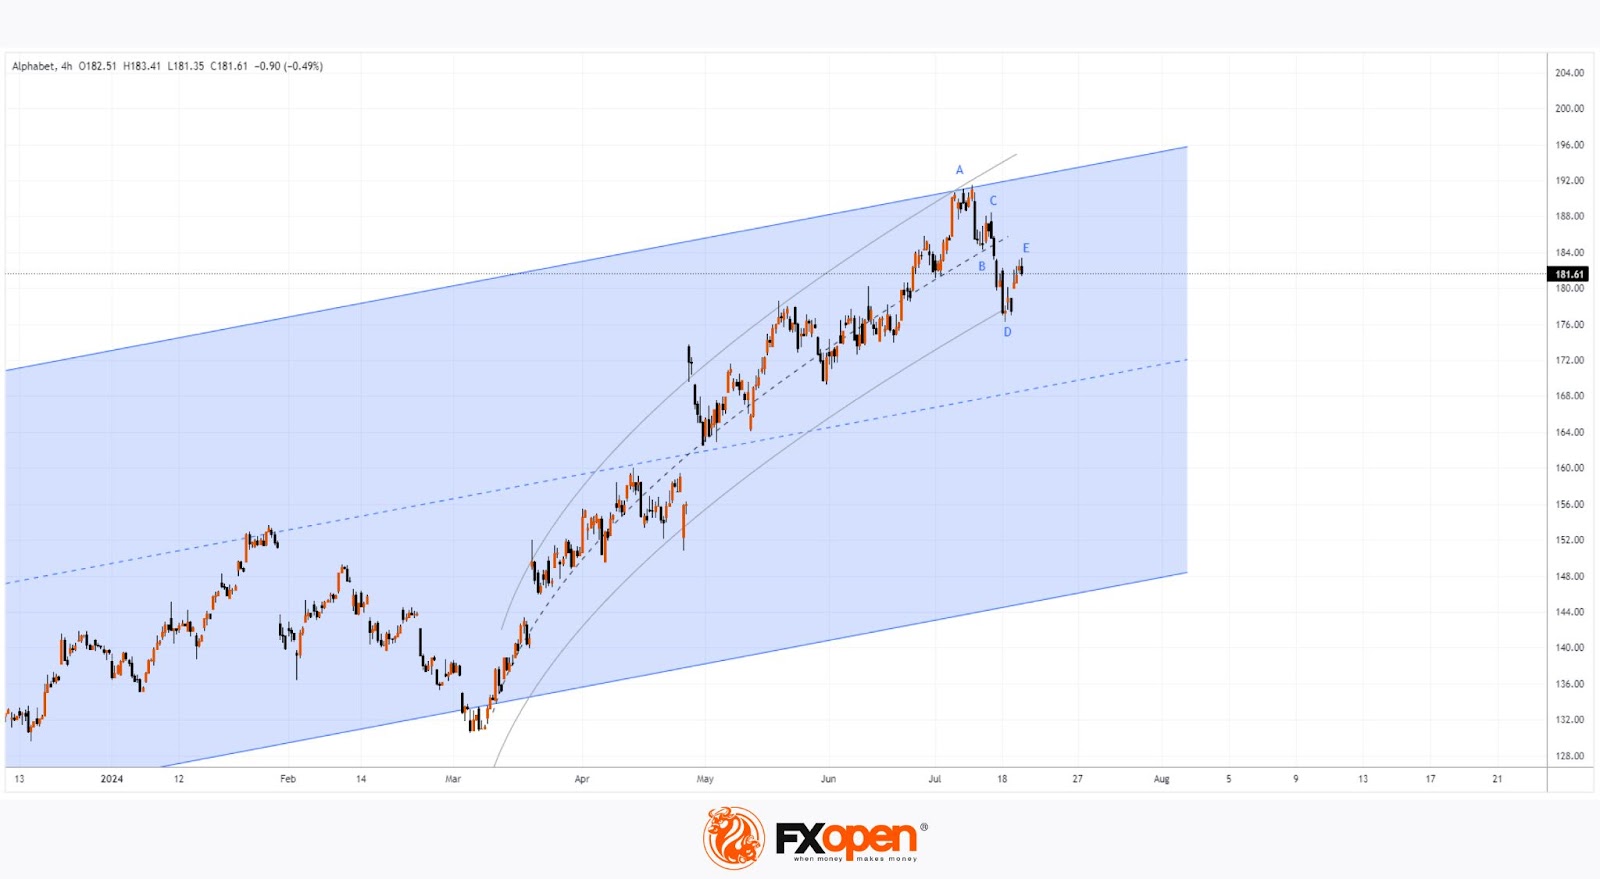
Technical analysis of GOOGL's chart after the report shows:
→ In 2024, the stock has been rising within an upward channel that started in 2023. The historic high set earlier this month marked the upper boundary of this channel, which acted as resistance and turned the price downwards.
→ The bullish impulse, shown by black lines, is losing strength as the price moved closer to the median line of the blue channel after the report.
→ The July structure of local extremes A-B-C-D-E indicates bearish sentiment, as each increase is approximately 50% of the preceding decline.
Bulls might hope for support from the blue median line to try and keep the price in the upper part of the blue channel.
39 Wall Street analysts surveyed by TipRanks provide positive forecasts:
→ 33 analysts recommend buying GOOGL shares, and none recommend selling;
→ The price forecast for GOOGL shares is $203.97 in 12 months (+12.20% from yesterday's close).
However, it's possible that GOOGL's price forecasts may worsen if the blue median line is broken by the bears.
Buy and sell stocks of the world's biggest publicly-listed companies with CFDs on FXOpen’s trading platform. Open your FXOpen account now or learn more about trading share CFDs with FXOpen.
This article represents the opinion of the Companies operating under the FXOpen brand only. It is not to be construed as an offer, solicitation, or recommendation with respect to products and services provided by the Companies operating under the FXOpen brand, nor is it to be considered financial advice.
Stay ahead of the market!
Subscribe now to our mailing list and receive the latest market news and insights delivered directly to your inbox.


Latest articles

European Currencies Decline: Pound Hits New Lows, Euro Under Pressure
European currencies continue to weaken against the US dollar amid rising geopolitical tensions and increased demand for safe-haven and liquid assets. Market participants are reducing exposure to riskier instruments, putting pressure on both the euro and the pound. Additional support

Market Analysis: GBP/USD Dips Further As EUR/GBP Regains Traction
GBP/USD failed to climb above 1.3500 and corrected some gains. EUR/GBP started a decent increase and might aim for more gains above 0.8700.
Important Takeaways for GBP/USD and EUR/GBP Analysis Today
· The British Pound
