


FXOpen

As the chart shows, Hong Kong’s Hang Seng Index (Hong Kong 50 on FXOpen) climbed above the 27,300 mark today – for the first time since summer 2021. The bullish momentum has been supported in part by corporate news. According to media reports:
→ Shares of Chinese EV maker NIO Inc. rose by around 5% following news that vehicle deliveries had increased by 64.1% year-on-year.
→ Shares of Ascletis Pharma Inc. jumped 12.8% after the company announced a share buyback programme.
→ Alibaba shares surged 4% after JPMorgan raised its price target by more than 40%, citing AI industry development and strong user engagement.
Since 1 September, the Hang Seng Index (Hong Kong 50 on FXOpen) has gained over 7%.
Technical Analysis of the Hang Seng Index Chart
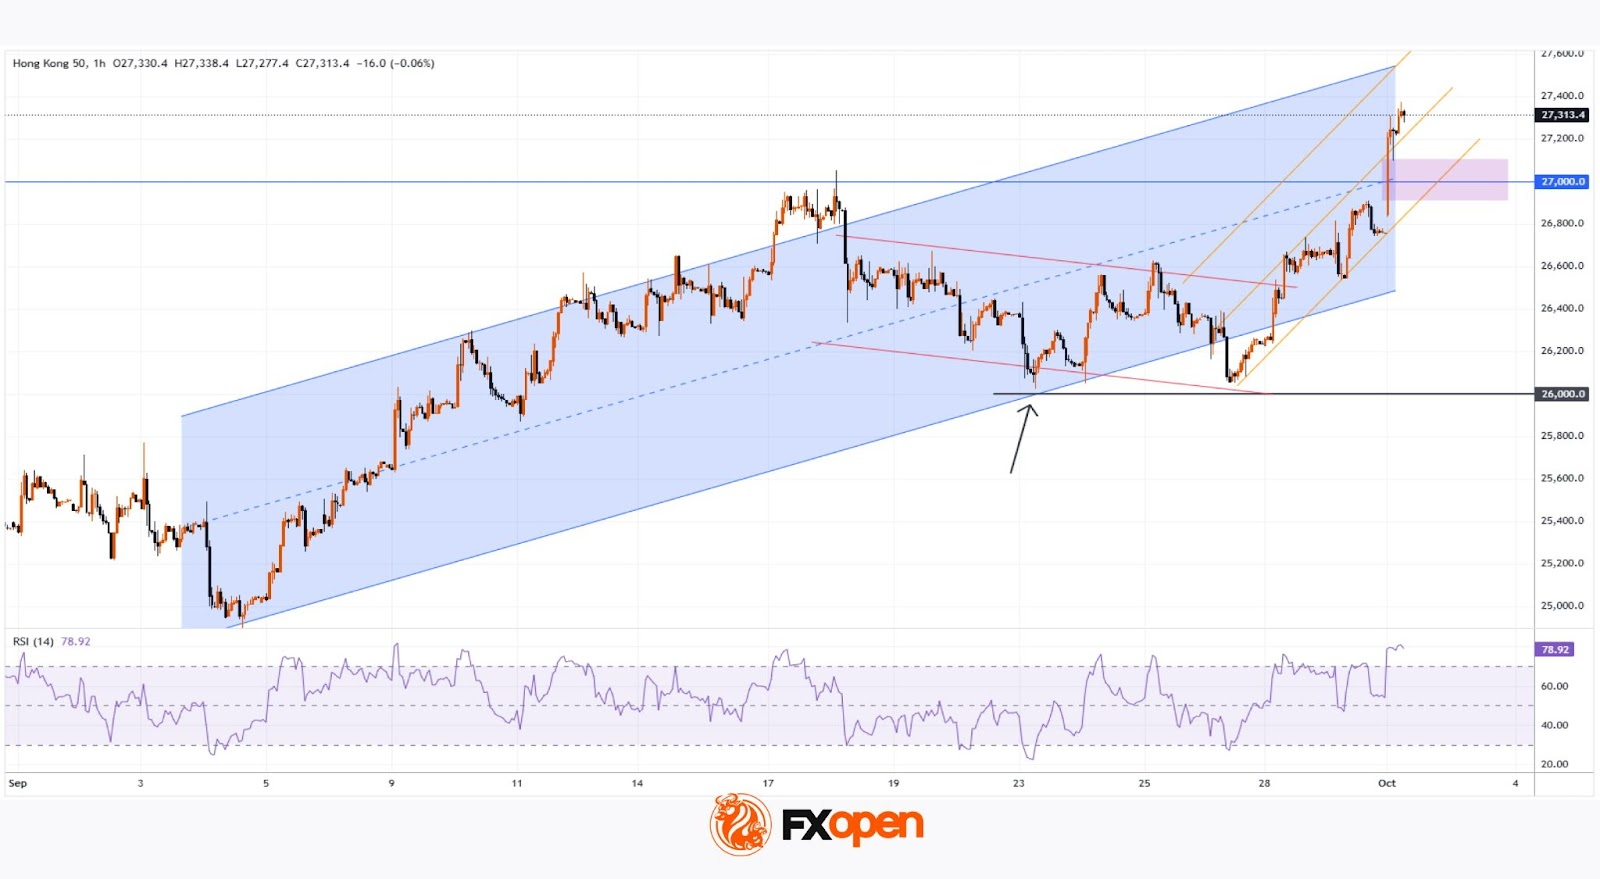
In our 23 September review of the index chart, we:
→ highlighted that the price had fallen to the lower boundary of the blue ascending channel;
→ noted signs of demand emerging around the psychological 26,000 level.
Since then (as shown by the arrow), price action has been supported by these levels. On 26 September, bears attempted once more to break below 26k, but failed – giving bulls the opportunity to seize control. This resulted in the formation of a steep upward trajectory, highlighted in orange.
From an optimistic perspective:
→ The market has resumed its uptrend, breaking above the corrective bull flag pattern (shown in red).
→ The September high near the psychological 27,000 level was broken decisively — the long candlestick points to a demand–supply imbalance favouring buyers, reinforcing the relevance of the bullish Fair Value Gap pattern highlighted in purple.
→ The price is now trading in the upper half of the blue channel (a sign of strong demand).
At the same time, the RSI indicator has entered the overbought zone. Once the first wave of positive sentiment fades, a bout of profit-taking could happen, which might trigger a correction — potentially involving a retest of the 27k level or the lower orange line.
Trade global index CFDs with zero commission and tight spreads (additional fees may apply). Open your FXOpen account now or learn more about trading index CFDs with FXOpen.
This article represents the opinion of the Companies operating under the FXOpen brand only. It is not to be construed as an offer, solicitation, or recommendation with respect to products and services provided by the Companies operating under the FXOpen brand, nor is it to be considered financial advice.
Stay ahead of the market!
Subscribe now to our mailing list and receive the latest market news and insights delivered directly to your inbox.


Latest articles

Market Analysis: Gold Price Slips Back, WTI Crude Oil Rally Gains Fresh Strength
Gold price rallied above $4,750 before correcting lower. Crude oil prices are rising and could climb further higher toward $110.00.
Important Takeaways for Gold and WTI Crude Oil Prices Analysis Today
· Gold price gained pace for a move

Consolidation Ahead of NFP: Commodity Currencies Search for Direction
Commodity-linked currencies have entered a consolidation phase following recent directional moves, as market participants adopt a wait-and-see approach ahead of key US labour market data. Current price action reflects a balance between ongoing demand for the US dollar and attempts

The Real Driver Behind the Dollar Rally: Market Insights with Gary Thomson
The US dollar has been firm, but the drivers behind the move may be more complex than they first appear.
While geopolitical tension and shifts in risk sentiment play a role, current price behaviour seems increasingly influenced by inflation expectations