


FXOpen

On Tuesday, Hong Kong's HSI index (traded as Hong Kong 50 on FXOpen) declined, erasing gains from the previous session due to worsening market sentiment following the release of disappointing Chinese economic data for November. As reported by the media:
→ China's export growth slowed to 6.7% year-on-year, falling short of the forecasted 8.5%, according to a Reuters survey. This marks a significant deceleration compared to the 12.7% growth recorded in October.
→ Additionally, Chinese imports contracted, decreasing by 3.9% year-on-year in November, further deteriorating from the 2.3% decline seen in the previous month.
These figures have heightened concerns about the state of China’s economy, with consumer demand remaining weak amid the potential for tariff increases under the Trump administration.
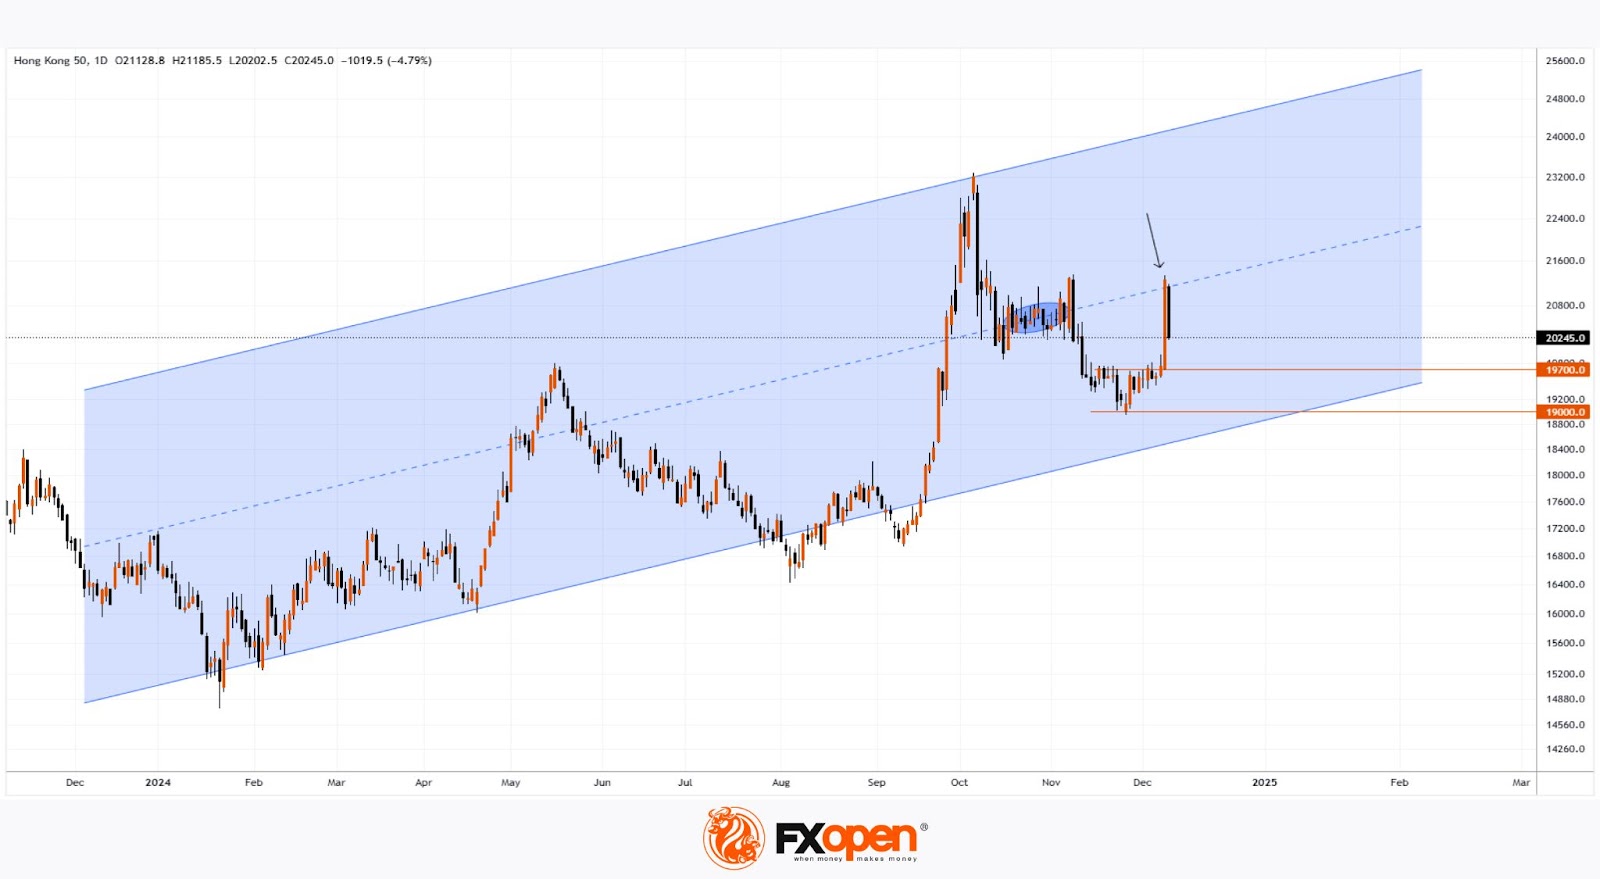
Technical analysis of the Hong Kong HSI Index chart (Hong Kong 50 on FXOpen) reveals that price action throughout 2024 has established an ascending channel (illustrated in blue). Notably:
→ The median line of the channel has previously acted as a "magnet" for price (highlighted with a blue oval), typically indicating equilibrium between supply and demand.
→ However, as marked with an arrow, it has recently acted as resistance, turning the price downward this week.
This sharp shift in sentiment suggests that the HSI index value (Hong Kong 50 on FXOpen) could retreat to the previous consolidation zone between the 19,000–19,700 levels.
Trade global index CFDs with zero commission and tight spreads (additional fees may apply). Open your FXOpen account now or learn more about trading index CFDs with FXOpen.
This article represents the opinion of the Companies operating under the FXOpen brand only. It is not to be construed as an offer, solicitation, or recommendation with respect to products and services provided by the Companies operating under the FXOpen brand, nor is it to be considered financial advice.
Stay ahead of the market!
Subscribe now to our mailing list and receive the latest market news and insights delivered directly to your inbox.


Latest articles

Market Analysis: GBP/USD Dips Further As EUR/GBP Regains Traction
GBP/USD failed to climb above 1.3500 and corrected some gains. EUR/GBP started a decent increase and might aim for more gains above 0.8700.
Important Takeaways for GBP/USD and EUR/GBP Analysis Today
· The British Pound


Market Insights with Gary Thomson: Oil, US Retail Sales & NFP in Focus
In this video, we’ll explore the key economic events and market trends, shaping the financial landscape. Get ready for insights into financial markets to help you navigate the week ahead. Let’s dive in!
In this episode of Market