


FXOpen

September is a month that statistically has the worst reputation for the S&P 500 (US SPX 500 mini on FXOpen). However, in 2025 things may be different, as today the index hit a record high, rising above 6,520 points.
Bullish sentiment is being driven by:
→ expectations of an interest rate cut in September, which is believed will give the US economy a positive boost (and increase corporate profits);
→ yesterday’s release of the ISM Services PMI (actual = 52.0, forecast = 50.9), which pointed to industrial growth;
→ strong corporate results – for example, Broadcom (AVGO) published a solid report yesterday.
Technical Analysis of the S&P 500 Chart
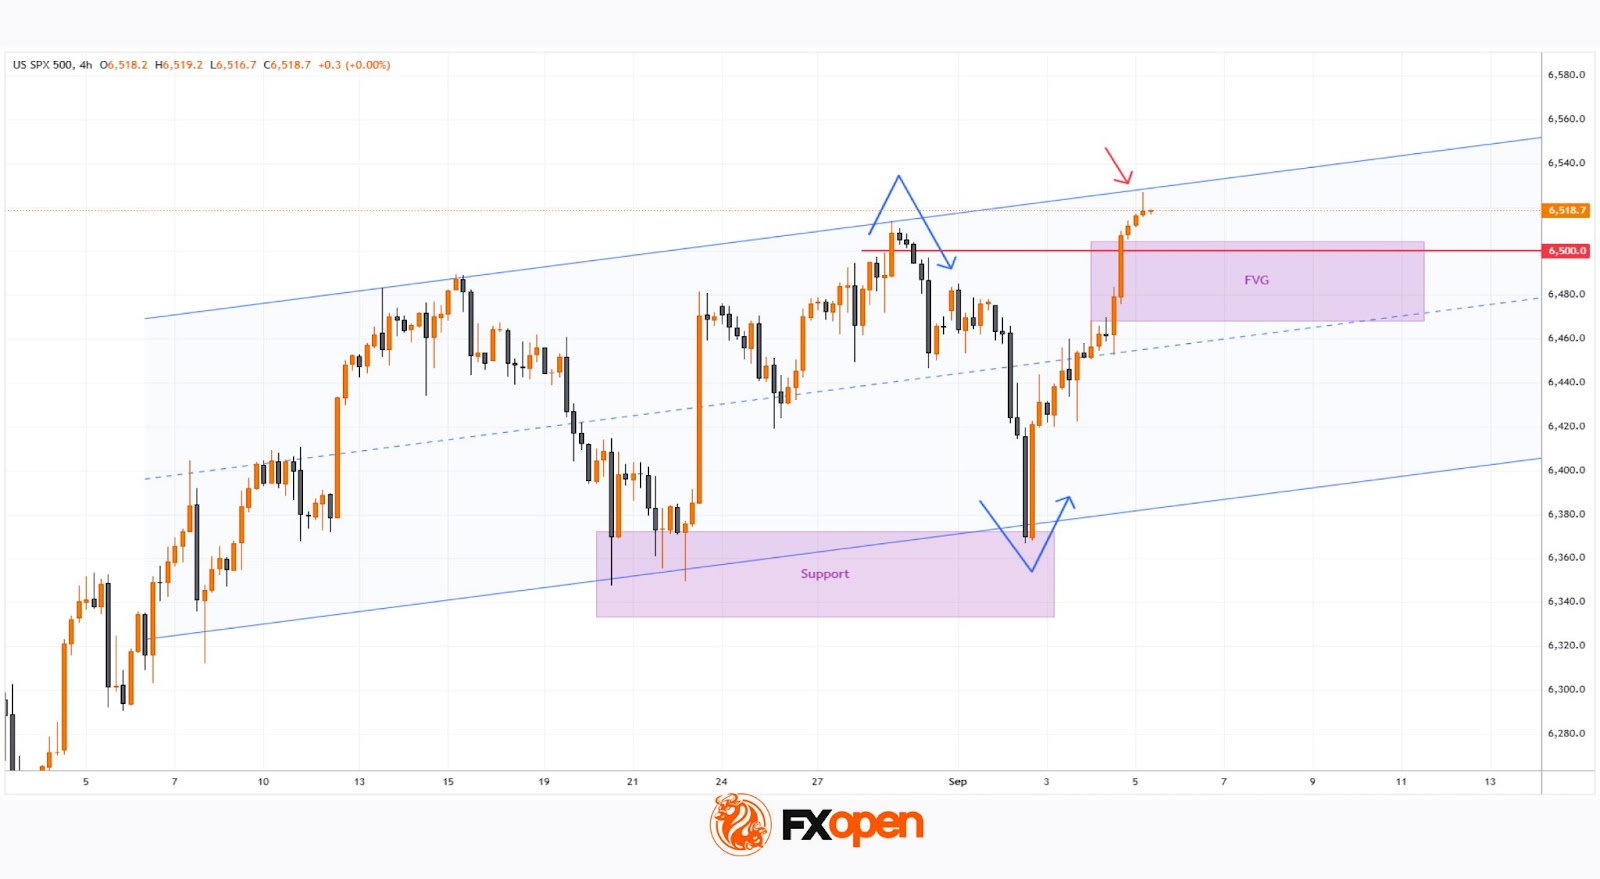
Analysing the 4-hour chart of the S&P 500 (US SPX 500 mini on FXOpen) on 28 August, we:
→ identified a support zone below 6,370;
→ noted several bearish signals and suggested that 6,500 could act as psychological resistance (with a potential false bullish breakout).
Indeed, since then (as shown by the blue arrows):
→ the price made a false breakout above 6,500;
→ then dropped to 6,370 to test the support zone;
→ after which it turned upwards again, forming a broad bullish engulfing pattern.
New data allows us to refine the position of the short-term channel (marked in blue), with the following perspectives:
→ Bearish view: the price is close to the upper boundary of the channel, which already showed resistance this morning (highlighted by the red arrow) – the candlestick has a long upper shadow.
→ Bullish view: yesterday’s rally demonstrated signs of imbalance in favour of buyers (as detailed in the description of the Fair Value Gap pattern), and the breakout above 6,500 looks genuine (since the price is consolidating above it).
Both viewpoints seem to be well-reasoned, but the market is unlikely to remain in balance, as today (15:30 GMT+3) the release of US labour market data is scheduled – arguably the key event of the week in the economic calendar.
Depending on the figures, the S&P 500 might:
→ attempt to break through the upper boundary;
→ or retreat towards the median of the blue channel.
Be prepared for volatility spikes.
Trade global index CFDs with zero commission and tight spreads (additional fees may apply). Open your FXOpen account now or learn more about trading index CFDs with FXOpen.
This article represents the opinion of the Companies operating under the FXOpen brand only. It is not to be construed as an offer, solicitation, or recommendation with respect to products and services provided by the Companies operating under the FXOpen brand, nor is it to be considered financial advice.
Stay ahead of the market!
Subscribe now to our mailing list and receive the latest market news and insights delivered directly to your inbox.


Latest articles

Tesla (TSLA) Shares Surge Following Musk’s Announcements
According to the chart, Tesla (TSLA) shares had been under significant pressure since the start of 2026: from their December high, they had lost around 25% of their value. The main bearish drivers included:
→ Intense competition from Chinese automakers, particularly

XTI/USD Analysis: WTI Oil Prices Under Pressure from Trump’s Statements
Yesterday, following a false bullish breakout above the psychological $100 level, WTI crude prices fell sharply towards the $85 area. The primary driver of this rapid decline was comments made by the US President.
According to Donald Trump:
→ the United
