


FXOpen

Yesterday, the S&P 500 stock index (US SPX 500 mini on FXOpen) set another historical high, closing near the 5650 level.
However, similar records are not observed on the charts of rally leaders from the first half of 2024 – NVDA's price is 8.6% below its historical high, MSFT is 3.1% lower, and GOOGL is 2.6% below its record.
And this isn't the only cause for concern. Insider sales, as indicated by reports to the SEC, could add to anxieties. For instance:
→ Bezos sold over $900 million worth of AMZN shares;
→ Nvidia board member Mark Stevens continues to sell NVDA shares, as does company CEO Jensen Huang.
According to Goldman Sachs, fund managers have increased their long positions in US stock index futures to record levels.
And according to a July survey of fund managers conducted by Bank Of America:
→ Market sentiment remains bullish amid expectations of a Fed rate cut and a soft landing for the economy;
→ Geopolitics now pose the biggest risk to markets, followed by inflation.
If professional market participants foresee further growth in the stock index, it might not be driven by shares of large companies.
On June 27, we discussed the bullish "cup and handle" pattern near the $190 level on the AMZN price chart. Since then, bulls have shown the ability to push the price towards the psychological level of $200, but they have not managed to sustain this success.
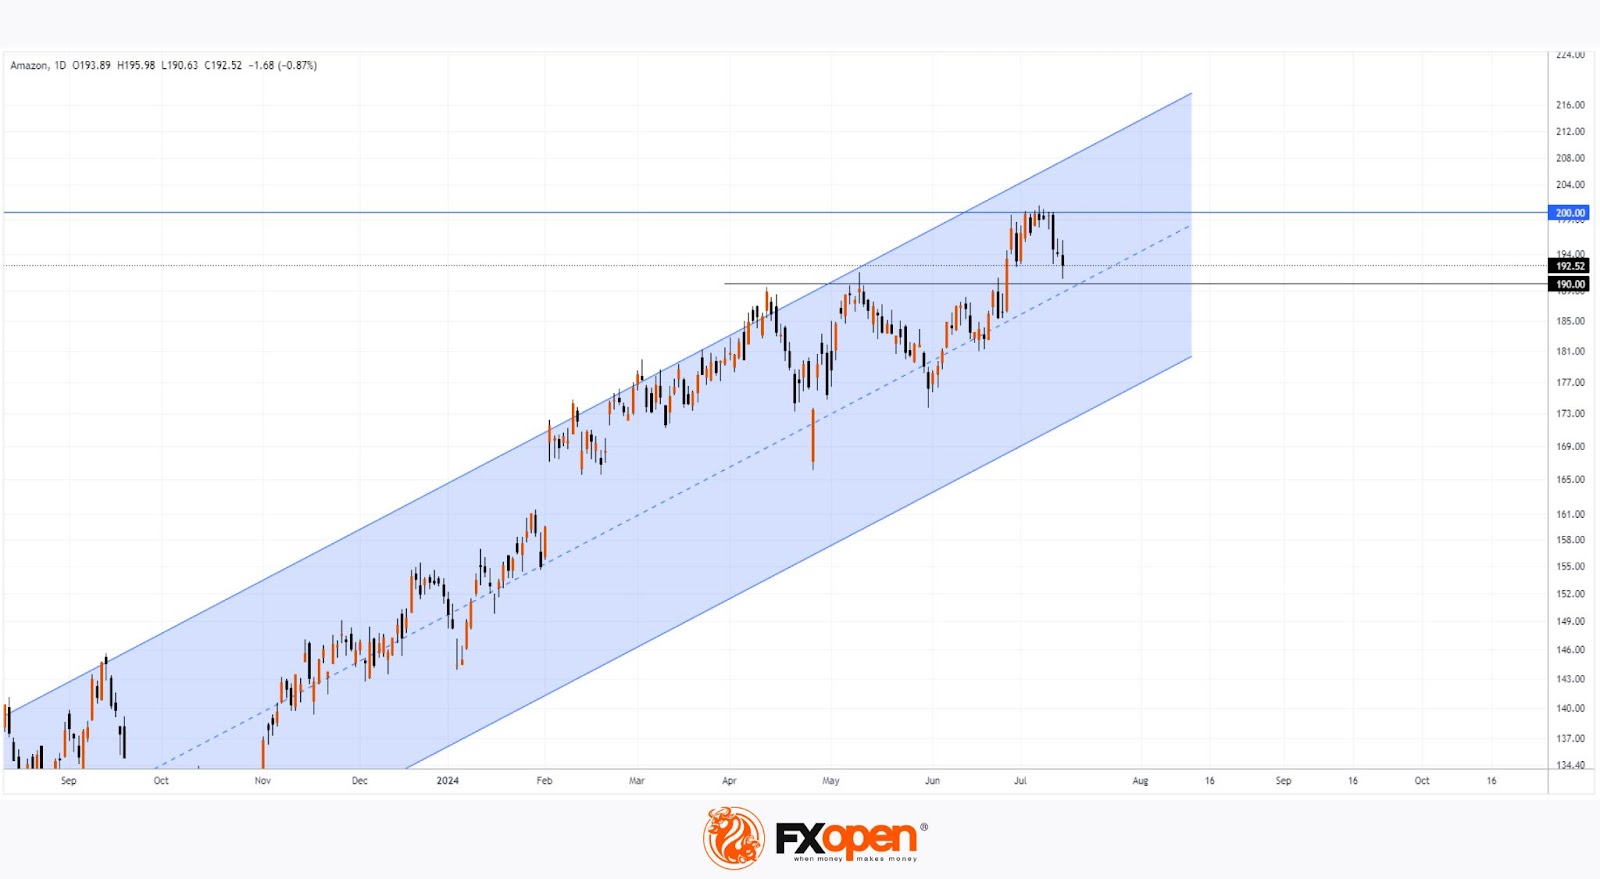
Today's technical analysis of the daily AMZN chart shows that:
→ The price is moving within an ascending channel (shown in blue);
→ After breaking above the $190 level, the price failed to reach the upper boundary of the channel – a bearish sign;
→ The breakout above the psychological level of $200 turned out to be false ("bull trap").
Support for bulls could come from:
→ The $190 level (former resistance);
→ The median line of the blue channel.
According to TipRanks, the average price target for AMZN, forecasted by Wall Street analysts, is $222.51 (up 15.46% from current levels) in 12 months.
Despite prevailing positivity in the stock market, weaker performance compared to the index and insider sales should caution regarding the future prospects of AMZN shares.
Trade global index CFDs with zero commission and tight spreads (additional fees may apply). Open your FXOpen account now or learn more about trading index CFDs with FXOpen.
This article represents the opinion of the Companies operating under the FXOpen brand only. It is not to be construed as an offer, solicitation, or recommendation with respect to products and services provided by the Companies operating under the FXOpen brand, nor is it to be considered financial advice.
Stay ahead of the market!
Subscribe now to our mailing list and receive the latest market news and insights delivered directly to your inbox.


Latest articles

Market Analysis: GBP/USD Dips Further As EUR/GBP Regains Traction
GBP/USD failed to climb above 1.3500 and corrected some gains. EUR/GBP started a decent increase and might aim for more gains above 0.8700.
Important Takeaways for GBP/USD and EUR/GBP Analysis Today
· The British Pound


Market Insights with Gary Thomson: Oil, US Retail Sales & NFP in Focus
In this video, we’ll explore the key economic events and market trends, shaping the financial landscape. Get ready for insights into financial markets to help you navigate the week ahead. Let’s dive in!
In this episode of Market