


Market Analysis: Brief Summary of the Q1 for the Stock Market
FXOpen

The graph of popular stock indices shows that since the beginning of the year, the Nasdaq index has managed to achieve the best result (almost + 40%), while the FTSE shows itself worse than others (about 0%). What are the reasons behind that?
The Nasdaq (NDX 100) is bullish because the index:
→ comprises tech stocks that are rapidly rising in value amid the AI-related hype. Businesswire writes that the AI industry will grow by +40% every year until 2026;
→ is less affected by concerns about bank failures in spring 2023.
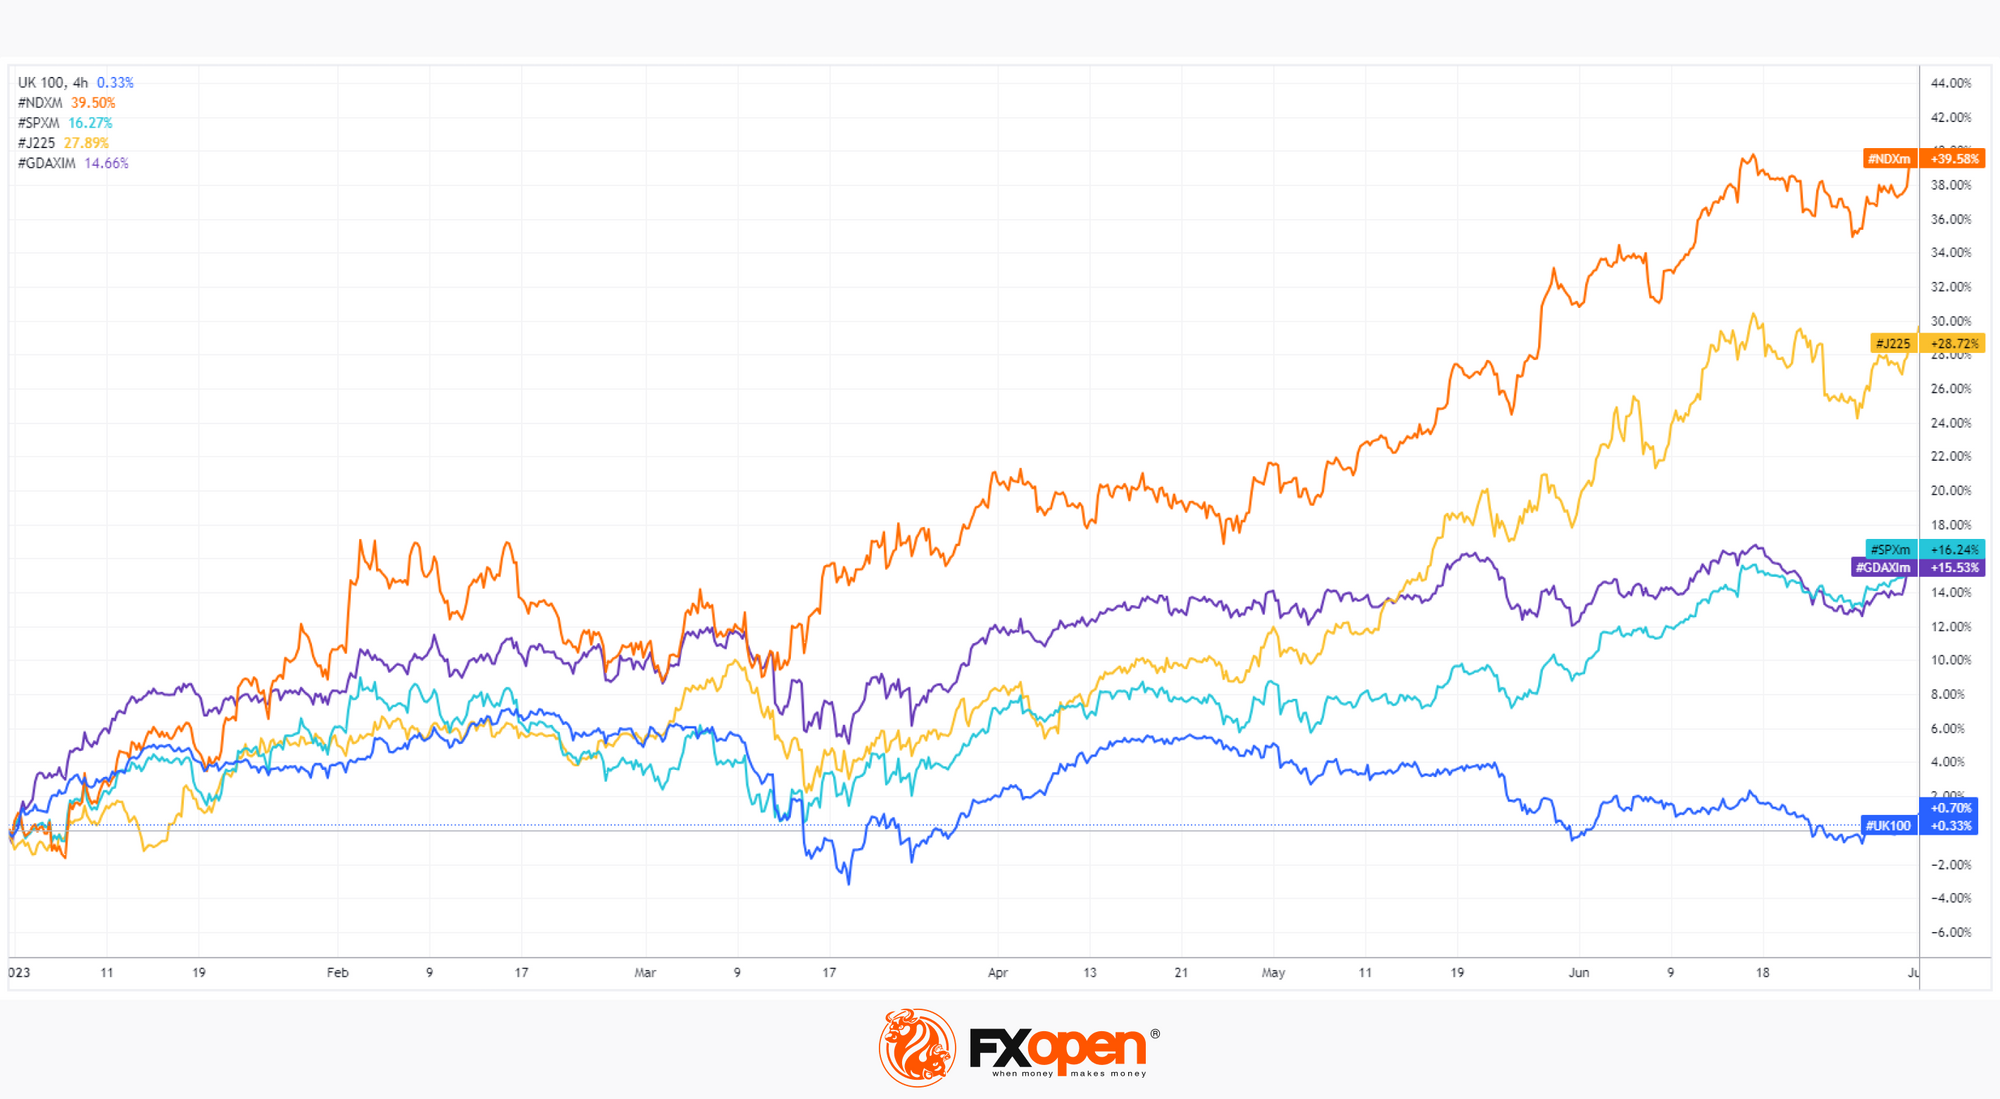
The FTSE (aka UK100) is bearish because technology companies that can benefit from AI development are not heavily weighted in the index, but commodity companies are relatively heavily weighted, and the price of oil has decreased by about 13% since the beginning of the year. High inflation rates in the UK also add to the negative. The FT writes about doubts that the Bank of England will be able to curb it.
It is likely that inflation, high central bank rates (which lead to bank failures) and the boom associated with AI will continue to be relevant topics to some extent in the second half of 2023.
Trade global index CFDs with zero commission and tight spreads (additional fees may apply). Open your FXOpen account now or learn more about trading index CFDs with FXOpen.
This article represents the opinion of the Companies operating under the FXOpen brand only. It is not to be construed as an offer, solicitation, or recommendation with respect to products and services provided by the Companies operating under the FXOpen brand, nor is it to be considered financial advice.
Stay ahead of the market!
Subscribe now to our mailing list and receive the latest market news and insights delivered directly to your inbox.


Latest articles

EUR/USD Eyes Gains As USD/CHF Weakness Deepens Again
EUR/USD started a fresh increase above 1.1700 and 1.1720. USD/CHF declined further and is now struggling below 0.7835.
Important Takeaways for EUR/USD and USD/CHF Analysis Today
· The Euro started a decent increase from

Apple: Earnings Day Above the Activity Zone
On 30 April, after the market close, Apple Inc. will release its financial results for the second quarter of fiscal 2026. The consensus forecast, based on estimates from 31 analysts, points to revenue of around $109.7 billion, with expected

USD/JPY and USD/CHF Near Key Levels: The Dollar Supported by the Fed
The US dollar continues to trend upwards following the Federal Reserve meeting, drawing support from the regulator’s moderately hawkish stance and comments by Jerome Powell. Markets interpret the Fed’s rhetoric as a signal that restrictive policy is likely