


FXOpen
Worries about a banking crisis and a recession amid high inflation seem to be a thing of the past. This week, the E-mini S&P 500 returned to its March 2022 levels, having recouped all the losses since the Fed's first rate hike.
According to UBS analysts, the current growth of indices in the stock market is associated with “inflation of greed”. That is, under the guise of rising costs, companies are increasingly raising prices for goods and services, seeking to increase earnings. This increases the profitability of their business and leads to an increase in the value of the shares.
According to FactSet, the latest reporting season was the highest actual performance in 2 years compared to analysts' expectations, with almost 80% of companies reporting first-quarter earnings beat expectations.
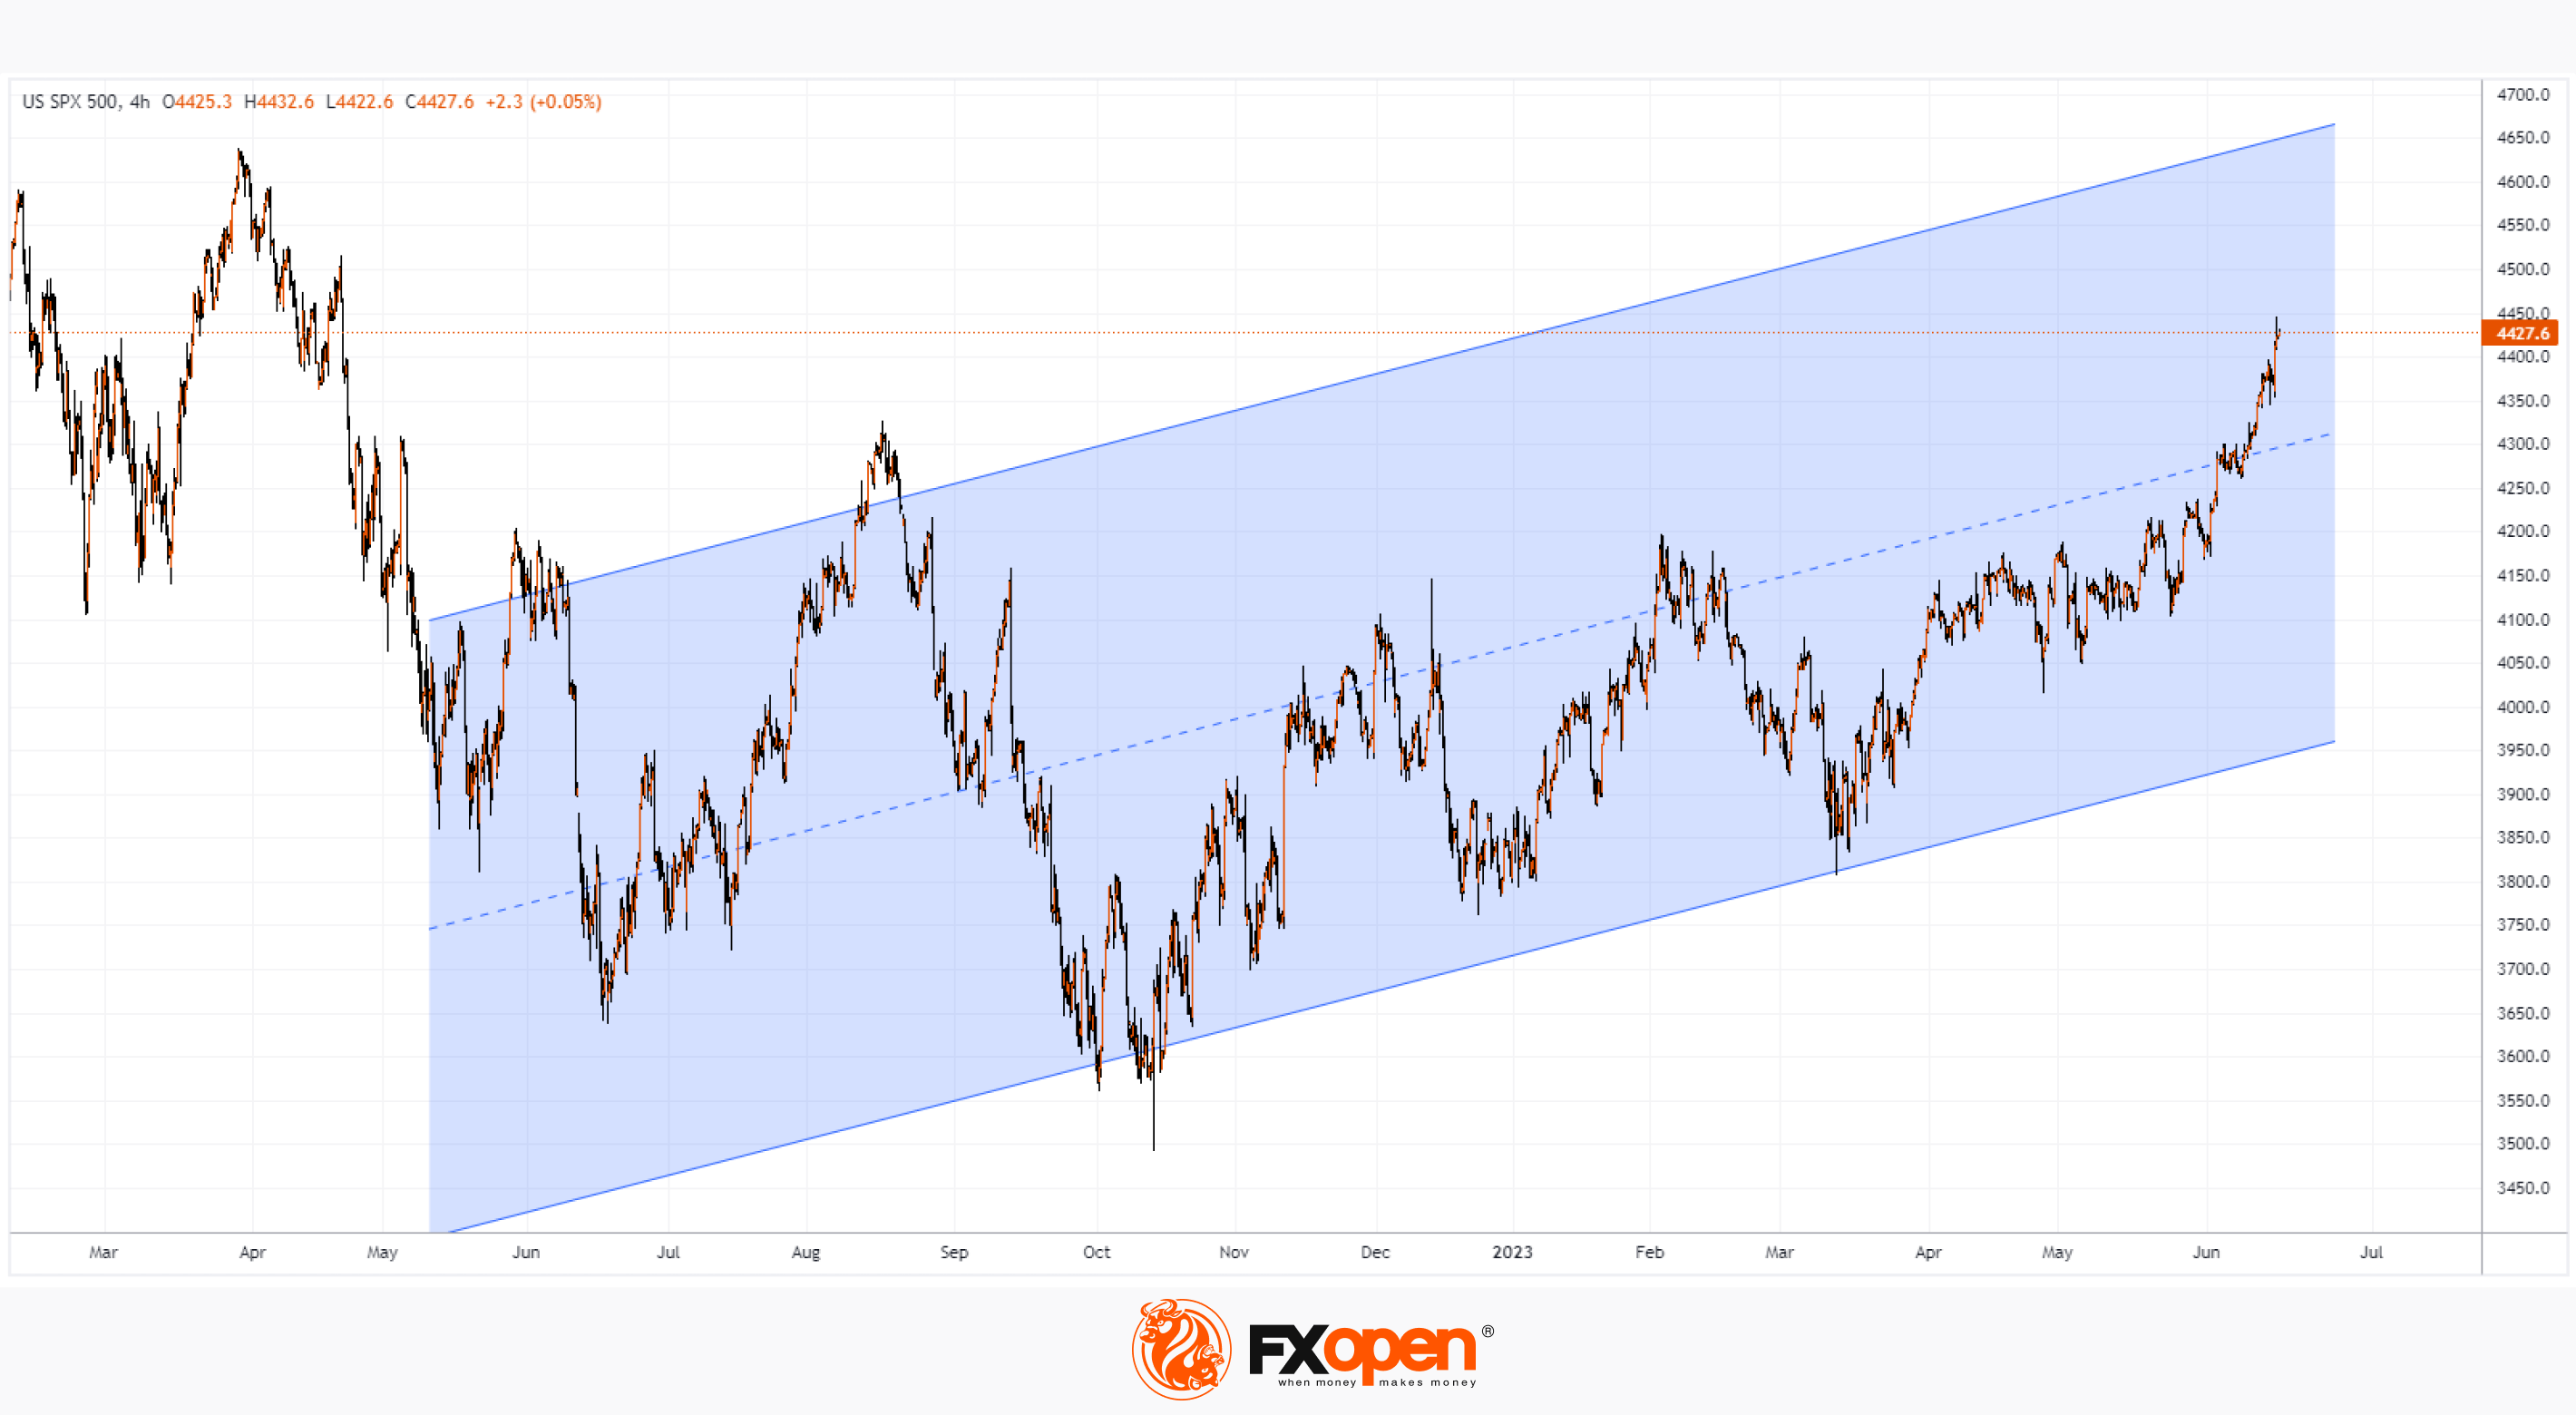
The E-mini S&P 500 chart shows the index rising within an ascending channel (shown in blue) that begins in 2022. A week of important news led to a bullish breakout of an important top of last summer, which opens up the prospect of growth to the upper border of the mentioned channel.
Trade global index CFDs with zero commission and tight spreads (additional fees may apply). Open your FXOpen account now or learn more about trading index CFDs with FXOpen.
This article represents the opinion of the Companies operating under the FXOpen brand only. It is not to be construed as an offer, solicitation, or recommendation with respect to products and services provided by the Companies operating under the FXOpen brand, nor is it to be considered financial advice.
Stay ahead of the market!
Subscribe now to our mailing list and receive the latest market news and insights delivered directly to your inbox.


Latest articles

Iran Conflict and Economic Data: Events in Focus for 2-6 March
Let’s discuss three upcoming events that may impact market activity across currencies, equities, and commodities.
✔️Washington and Israel struck Iran, the supreme leader of Iran Ayatollah Khamenei was killed. Iran retaliated, escalating tensions.
Oil jumped over 8%, global stocks
WTI Oil Trading Opens with a 10% Bullish Gap
On Friday, we warned that trading on Monday could be volatile — but not to this extent! The situation sharply escalated over the weekend following a large-scale strike by Israel and the US on targets in Iran, during which the supreme

Geopolitical Shock: Gold Price Storms $5,400 After Attack on Iran
The reason is clear: confirmed US and Israeli strikes on targets in Iran, including reports of the death of Supreme Leader Ali Khamenei, have triggered renewed demand for safe-haven assets, pushing gold prices higher.
As of Monday morning, news of