


EURUSD Analysis: Double Bearish Pattern
FXOpen

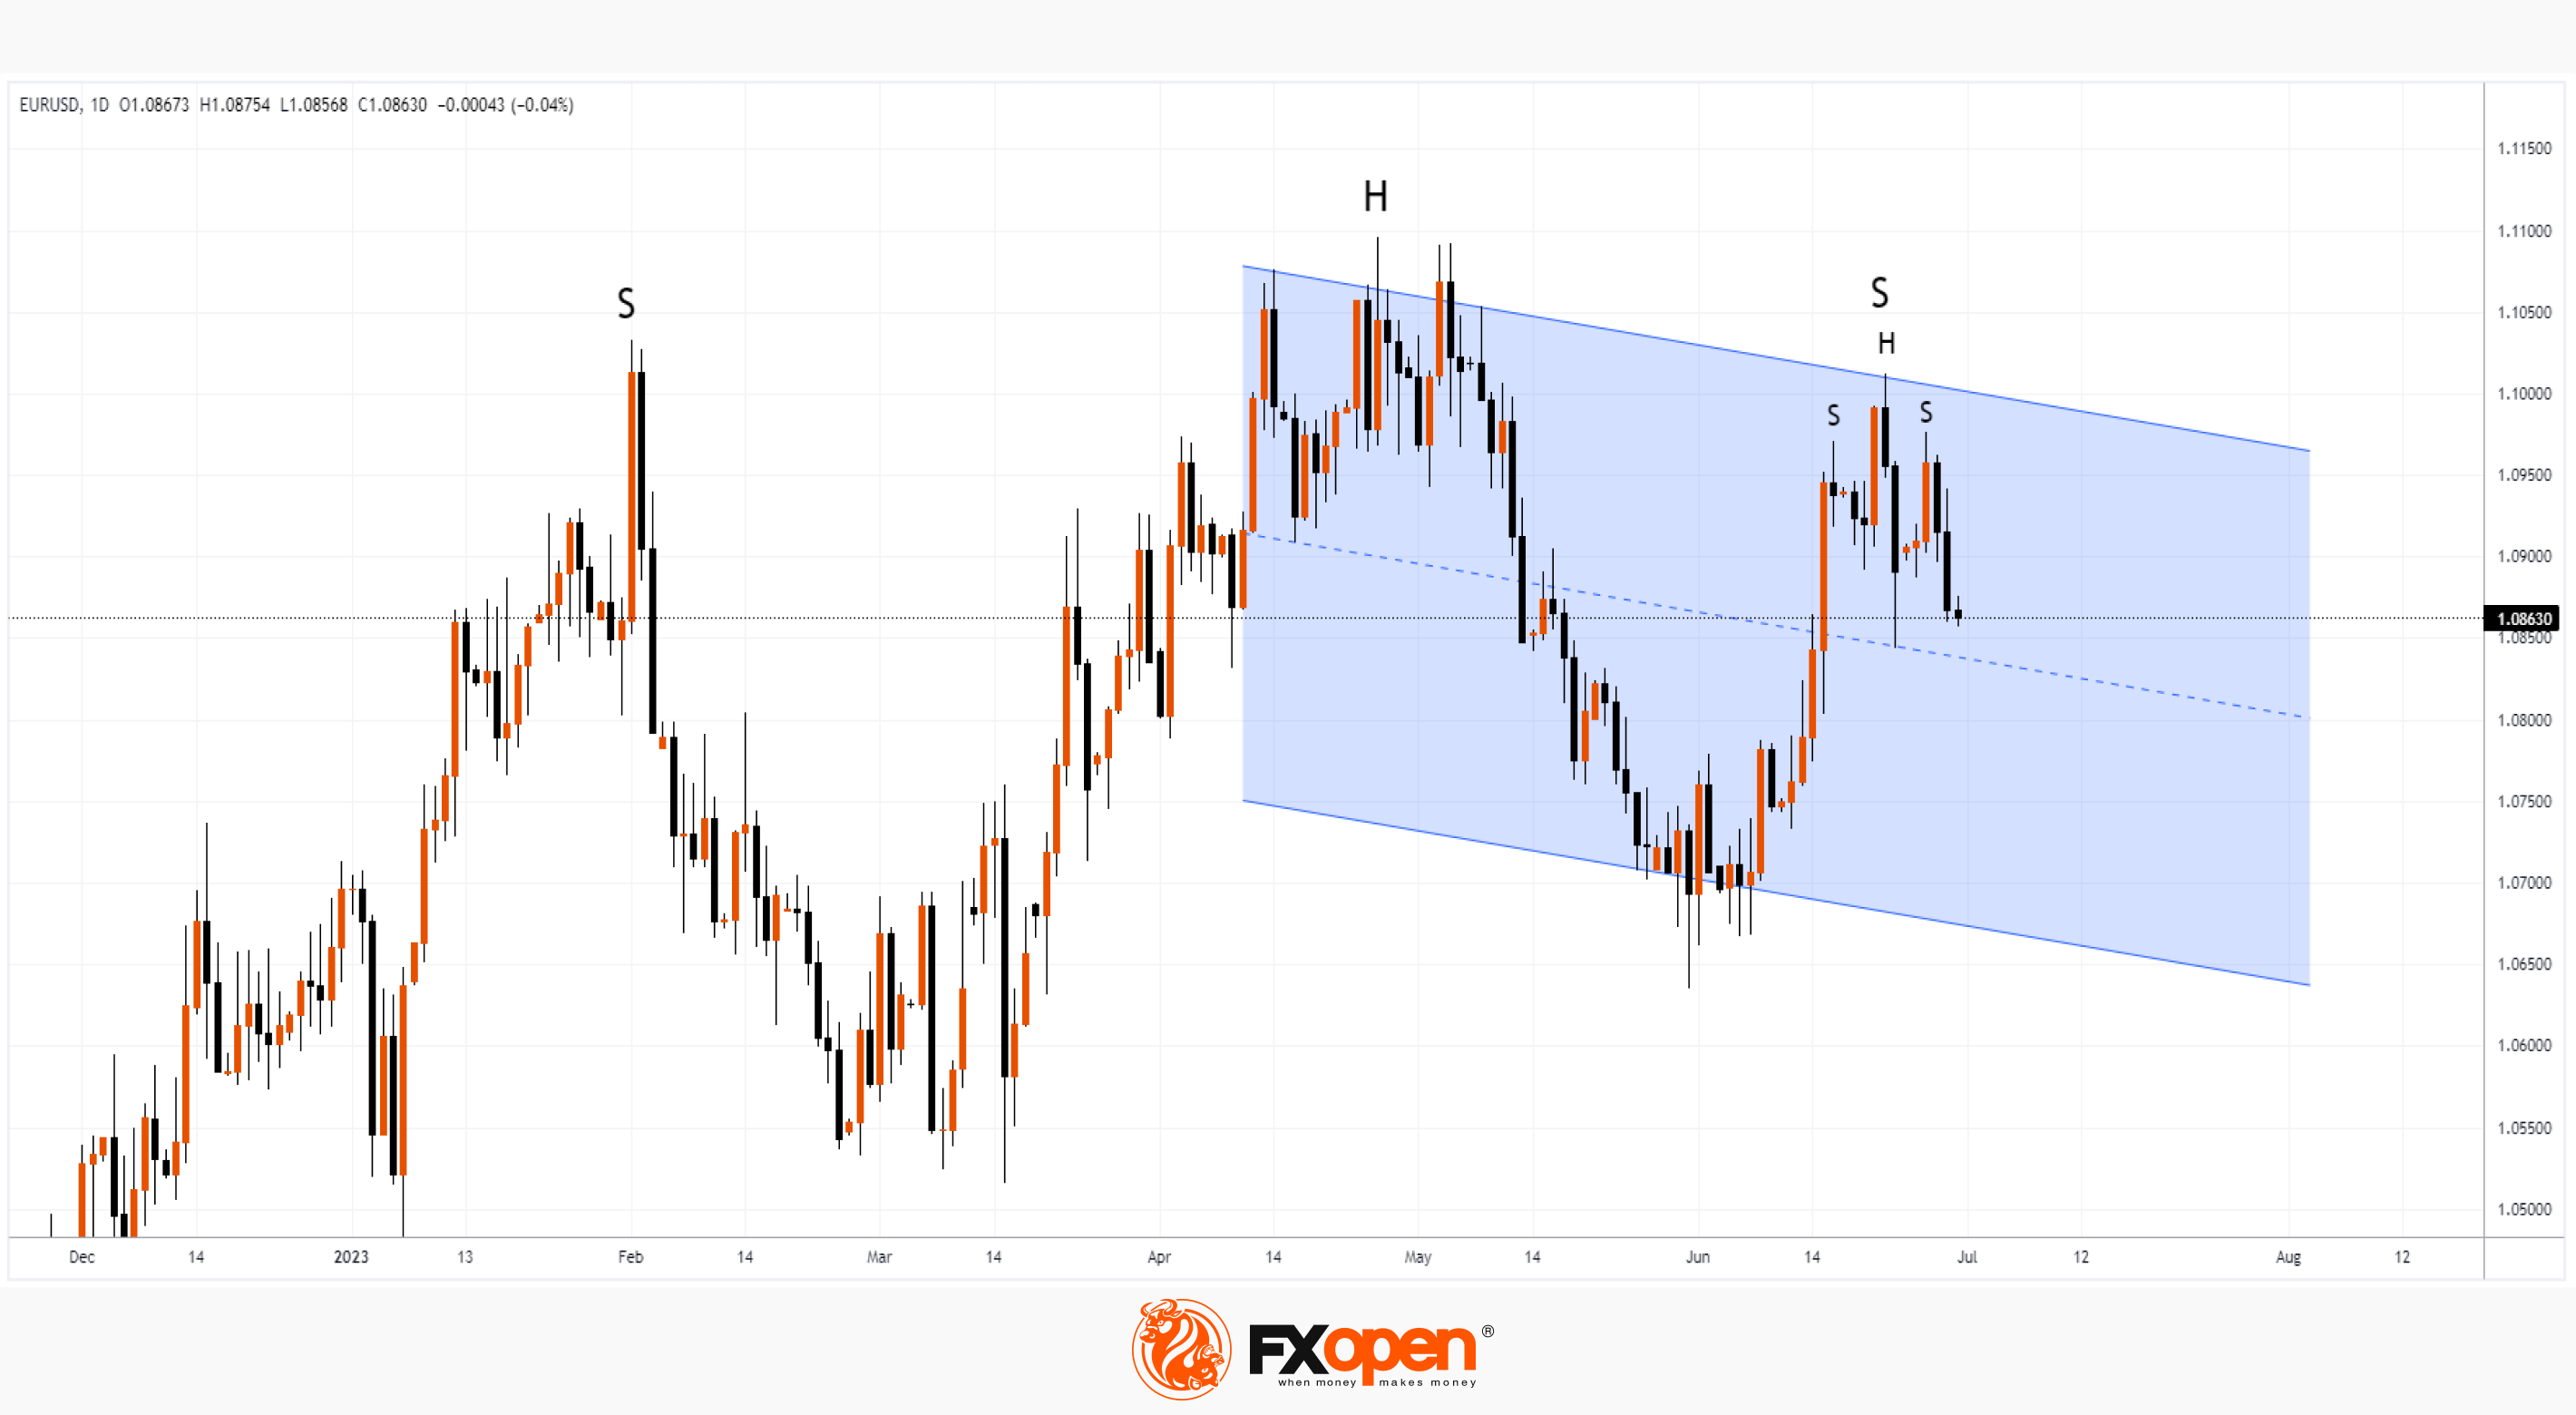
The EUR/USD chart indicates an interesting situation from the point of view of technical analysis, namely, a “nested” head-and-shoulders pattern.
The global bearish SHS pattern is formed by the peaks of February, April, June.
The local bearish SHS pattern is formed by three peaks formed in the second half of June. This should give confidence to the bears, who have statistics that indicate the effectiveness of the pattern.
Please note that inflation data will be published today:
→ 12:00 GMT+3: Core CPI Flash Estimate.
→ 12:00 GMT+3: US Core CPE is an indicator that the Fed pays special attention to.
Earlier this week, both Lagarde and Powell reaffirmed their resolve to fight inflation. The release of news today can provoke sharp movements in the market — for example, a breakdown of the neck line of the local SHS pattern. Get ready for bursts of volatility.
Trade over 50 forex markets 24 hours a day with FXOpen. Take advantage of low commissions, deep liquidity, and spreads from 0.0 pips (additional fees may apply). Open your FXOpen account now or learn more about trading forex with FXOpen.
This article represents the opinion of the Companies operating under the FXOpen brand only. It is not to be construed as an offer, solicitation, or recommendation with respect to products and services provided by the Companies operating under the FXOpen brand, nor is it to be considered financial advice.
Stay ahead of the market!
Subscribe now to our mailing list and receive the latest market news and insights delivered directly to your inbox.


Latest articles

AI Valuations Are Back in the Spotlight
Artificial intelligence remains the dominant investment theme of 2026, but investors are increasingly questioning whether AI stock valuations are keeping pace with reality.
💰 Big Tech continues to invest at an unprecedented scale, with hyperscaler AI spending projected to exceed $800

AUD/CAD: Months of Indecision — Is a Breakout Finally Coming?
The Australian dollar has clawed back most of its end-of-June losses, when it touched three-month lows against the greenback amid escalating Middle East tensions. Since then, sentiment has improved: the RBA's Assistant Governor Sarah Hunter signalled the board stands ready

USD/JPY: Battling at the Top of the Triangle
On 3 July, Japan's Finance Minister, Satsuki Katayama, stated that the Ministry of Finance remains in close contact with US authorities regarding developments in USD/JPY as the yen traded near its weakest level in almost 40 years. Similar verbal