


FXOpen

The record high of about USD 2,130 an ounce was set just after the weekend in low-liquid Asian markets. By the nature of the movement, it looked more like a cascading triggering of sellers’ stop losses, rather than finding a stable balance between supply and demand, since after the candle with a long upper tail, the quote began to fall. During the European session it fell to 2,060, and during the American session it fell to 2,030. So in less than a day, the price of gold fell about USD 100, making Monday's close further from the record top than Friday's close — essentially similar to a change in market sentiment, in which a bearish engulfing pattern is formed.
From a fundamental point of view, the gold market is influenced by:
→ Jerome Powell's words that expectations of a rate cut may be “premature”;
→ positioning traders at the beginning of the working week. Important news on the US labor market is expected on Friday.
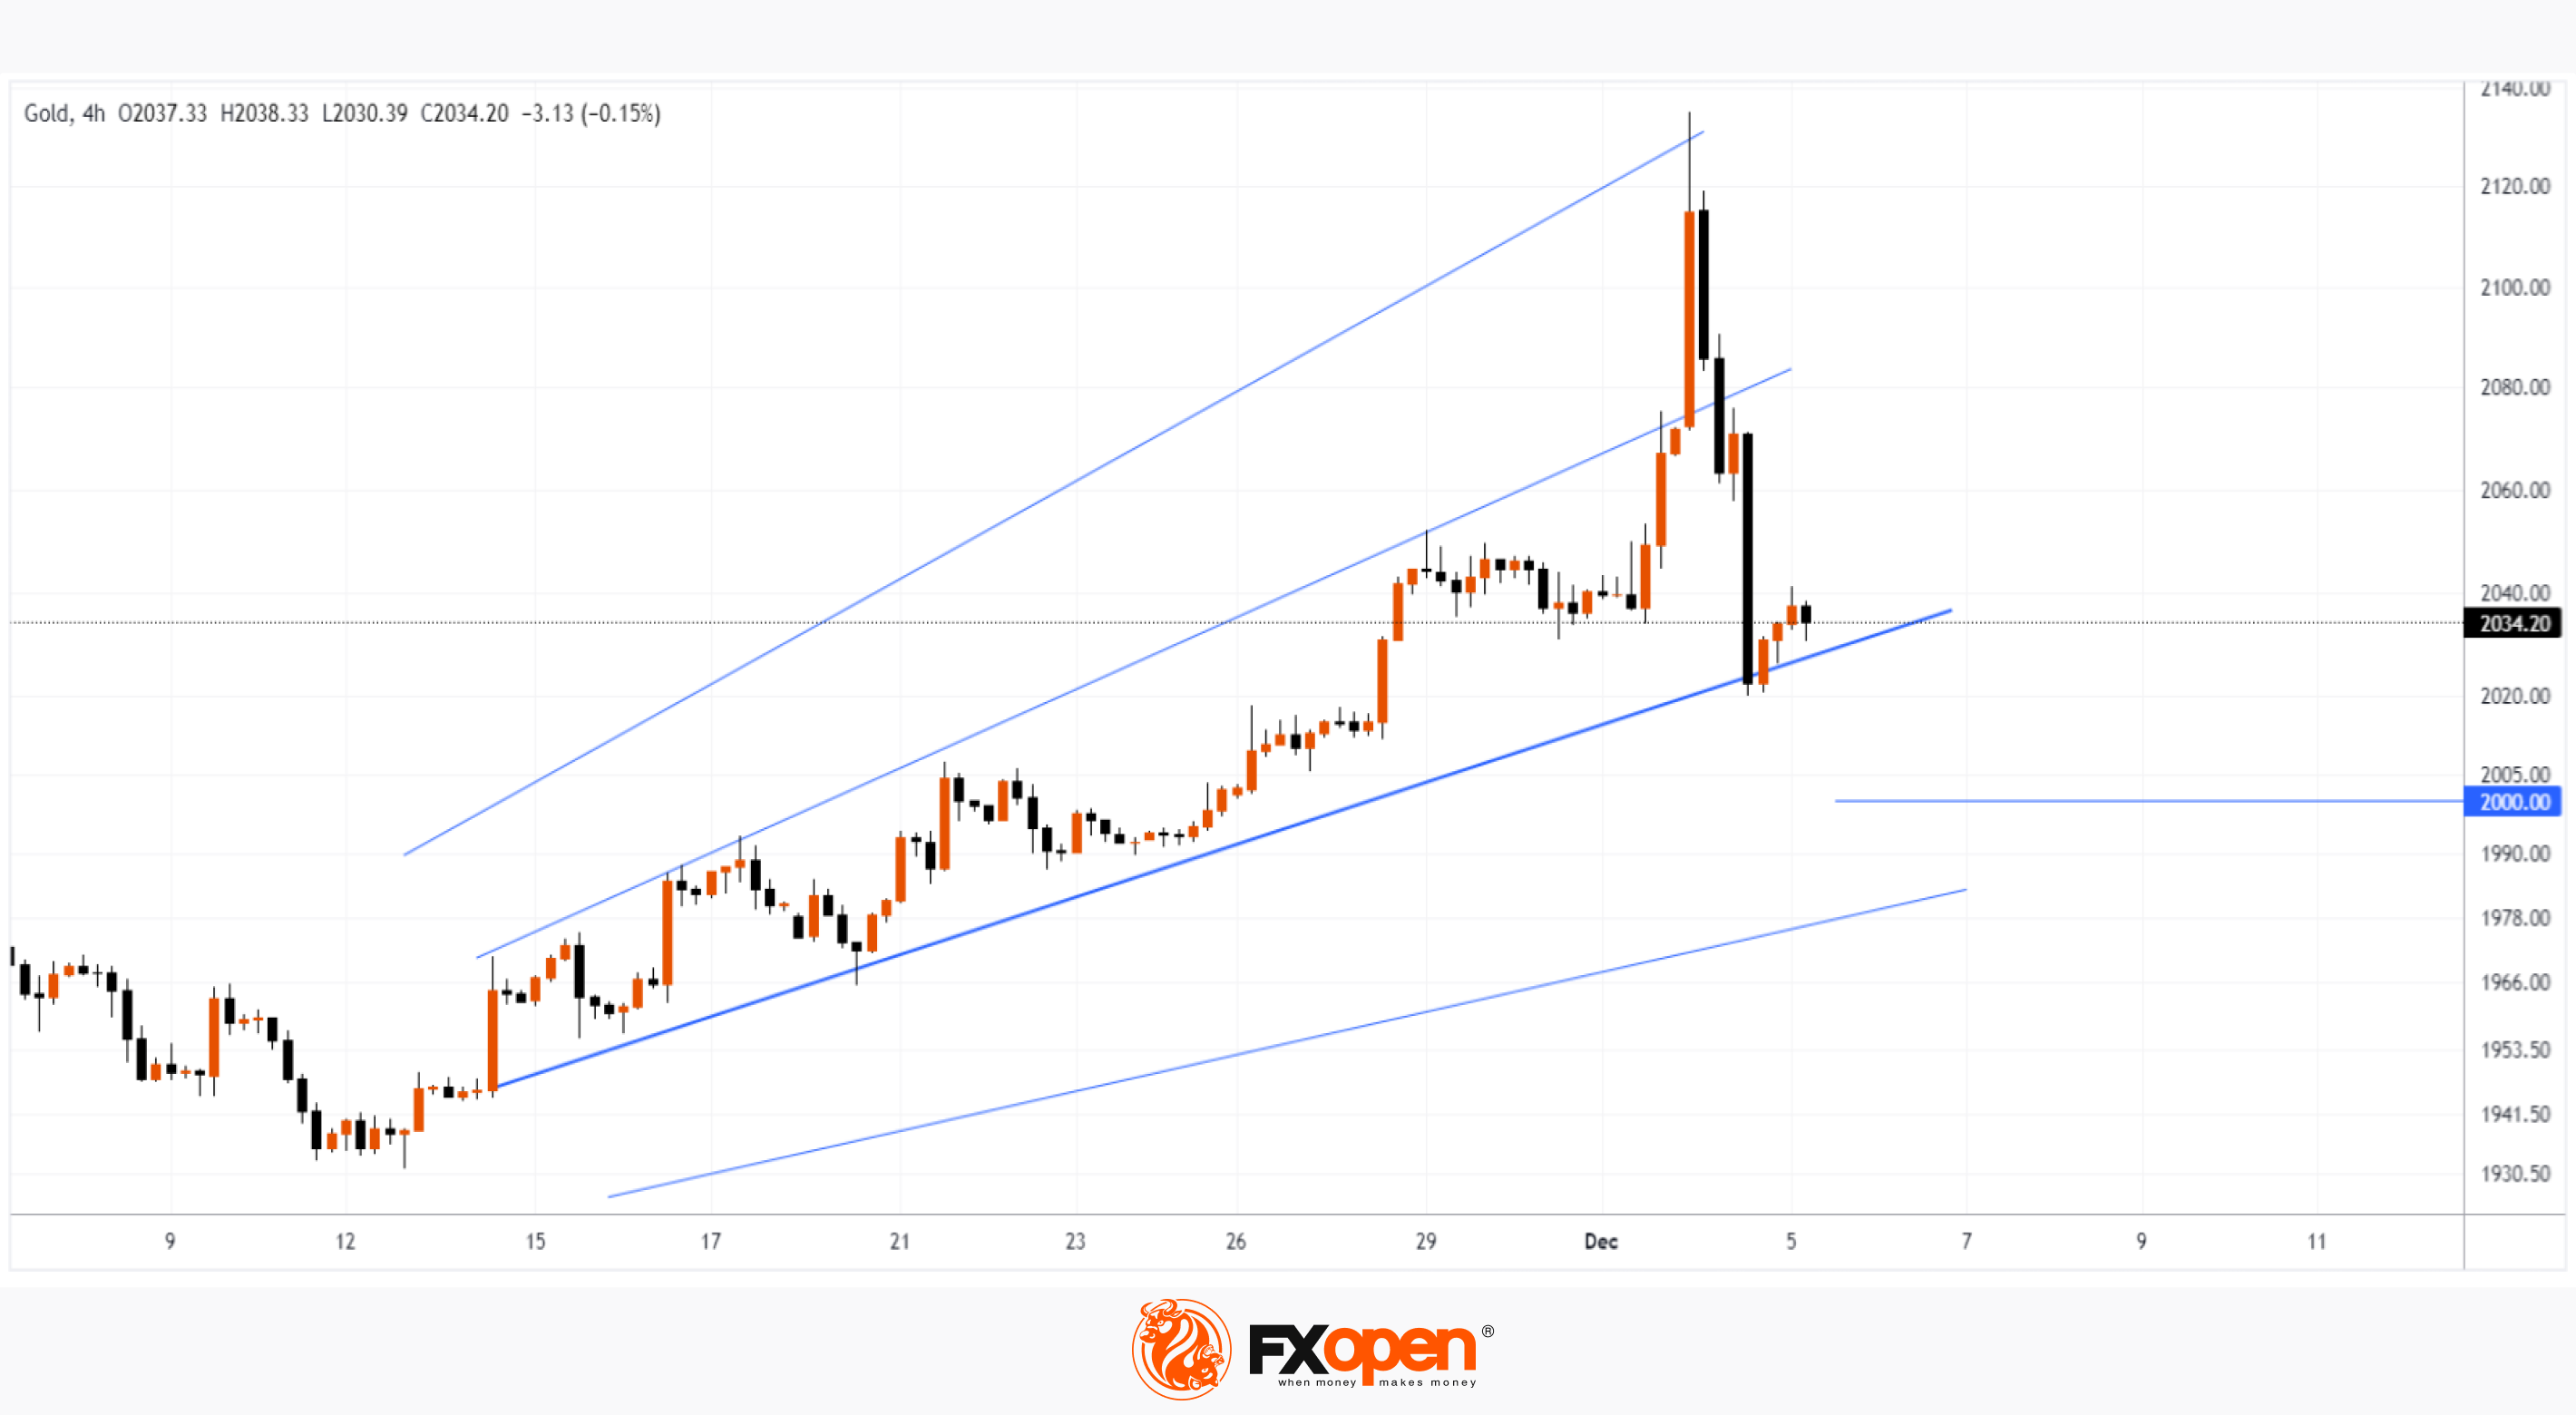
From a technical point of view, the gold price chart has a structure of trend lines that resemble a Gann fan. The price found support near one of them (shown in double thickness), thereby stopping Monday's fall. It is possible that if the bounces from this line are weak, the downward momentum may resume. In this case, the bears may try to break through the psychological level of USD 2,000 to test the next line from the mentioned structure.
Start trading commodity CFDs with tight spreads (additional fees may apply). Open your trading account now or learn more about trading commodity CFDs with FXOpen.
This article represents the opinion of the Companies operating under the FXOpen brand only. It is not to be construed as an offer, solicitation, or recommendation with respect to products and services provided by the Companies operating under the FXOpen brand, nor is it to be considered financial advice.
Stay ahead of the market!
Subscribe now to our mailing list and receive the latest market news and insights delivered directly to your inbox.


Latest articles

Consolidation Ahead of NFP: Commodity Currencies Search for Direction
Commodity-linked currencies have entered a consolidation phase following recent directional moves, as market participants adopt a wait-and-see approach ahead of key US labour market data. Current price action reflects a balance between ongoing demand for the US dollar and attempts

The Real Driver Behind the Dollar Rally: Market Insights with Gary Thomson
The US dollar has been firm, but the drivers behind the move may be more complex than they first appear.
While geopolitical tension and shifts in risk sentiment play a role, current price behaviour seems increasingly influenced by inflation expectations

EUR/USD and USD/CHF Pull Back: Market Reacts to Fundamentals
European currencies have shown a recovery in recent trading sessions after their recent decline, displaying early signs of a reversal. The US dollar is weakening amid expectations surrounding upcoming US macroeconomic data, while market participants are reassessing their short-term positions