


FXOpen

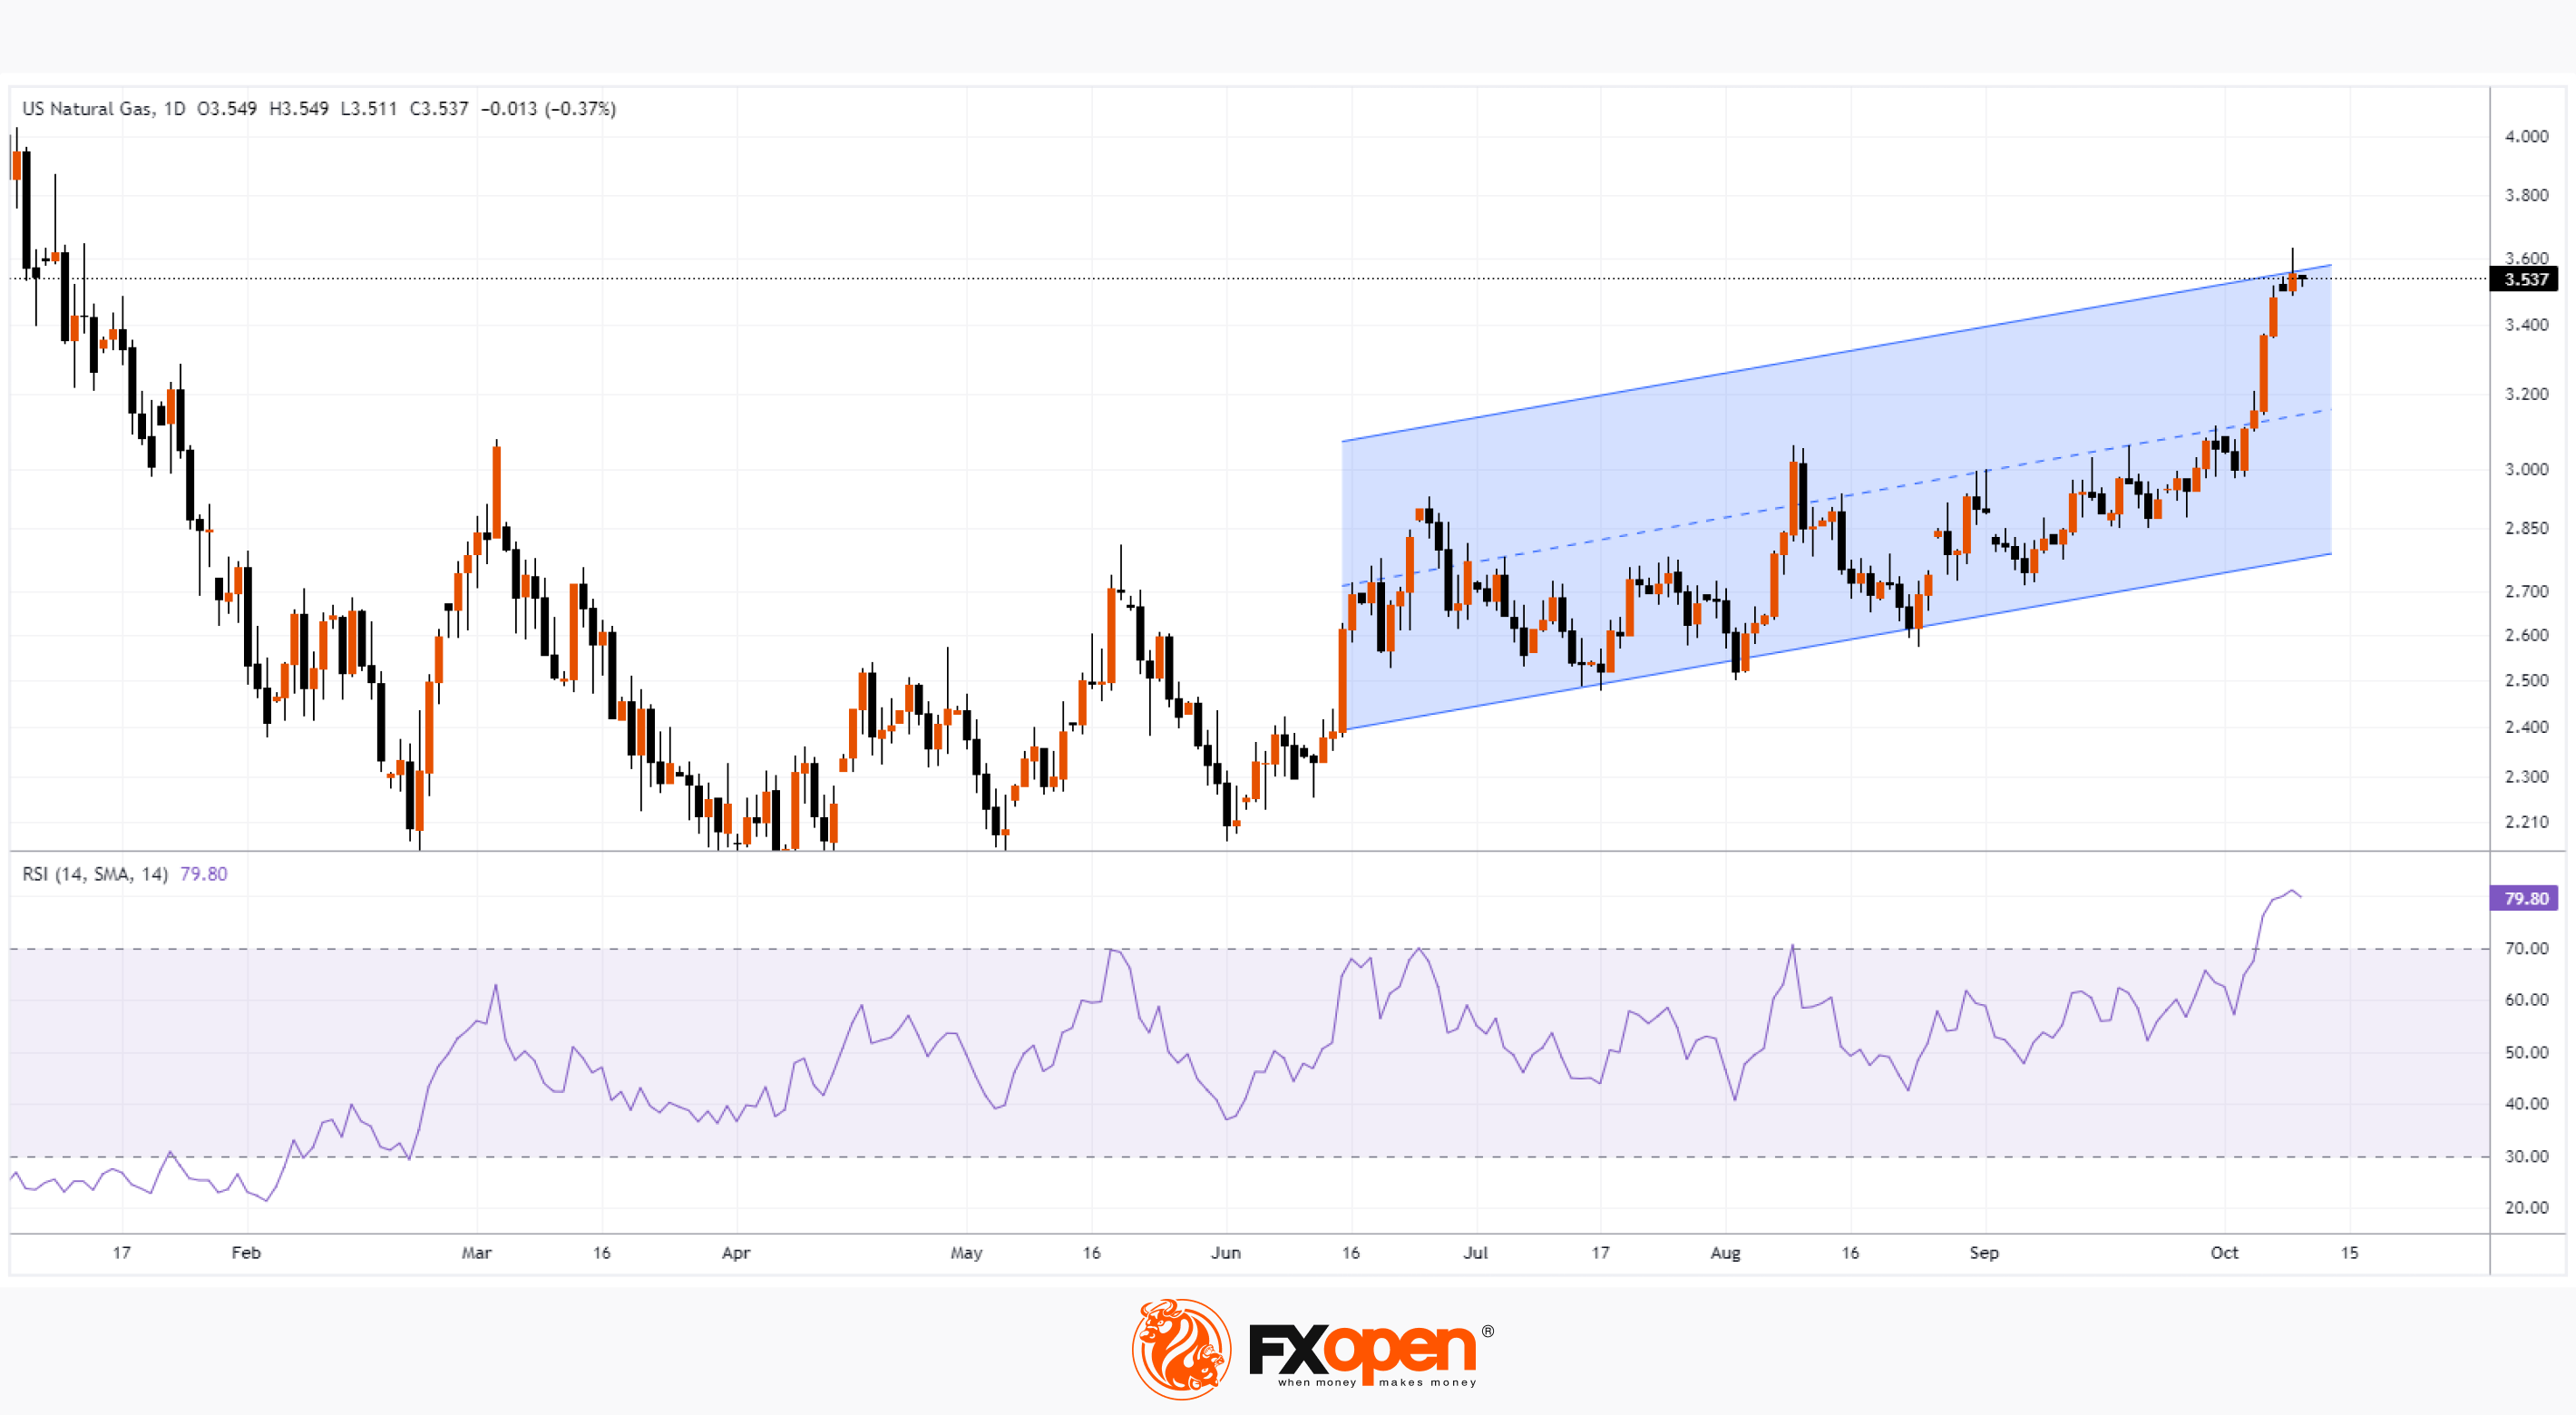
As the chart shows, yesterday, the price of gas rose above USD 3.60 for the first time since January of this year.
It can be assumed that events in Israel contributed to the price increase, since the Middle East is an important supplier of gas.
However, note that the bullish momentum started much earlier — gas prices have risen approximately 20% since the October 3 low. This confirms our assumptions about the bullish trend, which we published in the review on August 25th.
Perhaps the price of gas is influenced by seasonal factors and fears that weather conditions in the coming winter will be difficult.
Should we count on the continuation of the bullish trend?
If forecasters’ predictions worsen and the conflict in the Middle East flares up, this will certainly increase the likelihood of further price increases.
But in the short term, there are prerequisites for the formation of a rollback, since:
→ RSI indicates severe overbought;
→ the price has reached the upper limit of the parallel channel;
→ the tapering candles of the last days and the beginning of Tuesday demonstrate the presence of sellers — it is permissible to assume that buyers are taking profits.
Please note that on Thursday at 17:30 GMT+3, gas reserves data will be published — this may affect the current balance of supply and demand.
Start trading commodity CFDs with tight spreads (additional fees may apply). Open your trading account now or learn more about trading commodity CFDs with FXOpen.
This article represents the opinion of the Companies operating under the FXOpen brand only. It is not to be construed as an offer, solicitation, or recommendation with respect to products and services provided by the Companies operating under the FXOpen brand, nor is it to be considered financial advice.
Stay ahead of the market!
Subscribe now to our mailing list and receive the latest market news and insights delivered directly to your inbox.


Latest articles

European Currencies Decline: Pound Hits New Lows, Euro Under Pressure
European currencies continue to weaken against the US dollar amid rising geopolitical tensions and increased demand for safe-haven and liquid assets. Market participants are reducing exposure to riskier instruments, putting pressure on both the euro and the pound. Additional support

Market Analysis: GBP/USD Dips Further As EUR/GBP Regains Traction
GBP/USD failed to climb above 1.3500 and corrected some gains. EUR/GBP started a decent increase and might aim for more gains above 0.8700.
Important Takeaways for GBP/USD and EUR/GBP Analysis Today
· The British Pound
