


FXOpen

The decline to current levels from the peak of the top of the year, set on July 19, exceeded 10%, which is generally considered to be the trigger for the start of the correction. According to statistics, this is the 70th official correction since the index was created in February 1971.
Despite the positive report from Microsoft, the bearish dynamics of the NASDAQ index were determined by the decline in shares of Tesla and Google, as well as the rise in the yield of long-term treasury bonds, which increased the cost of borrowing.
Futures for the NASDAQ index are declining amid falling META shares. How strong can the correction be? According to the Dow Jones Industrial Average for the last 20 corrections:
→ it took Nasdaq an average of 3 months to improve its performance;
→ after 1 year, the index added an average of 14.4%.
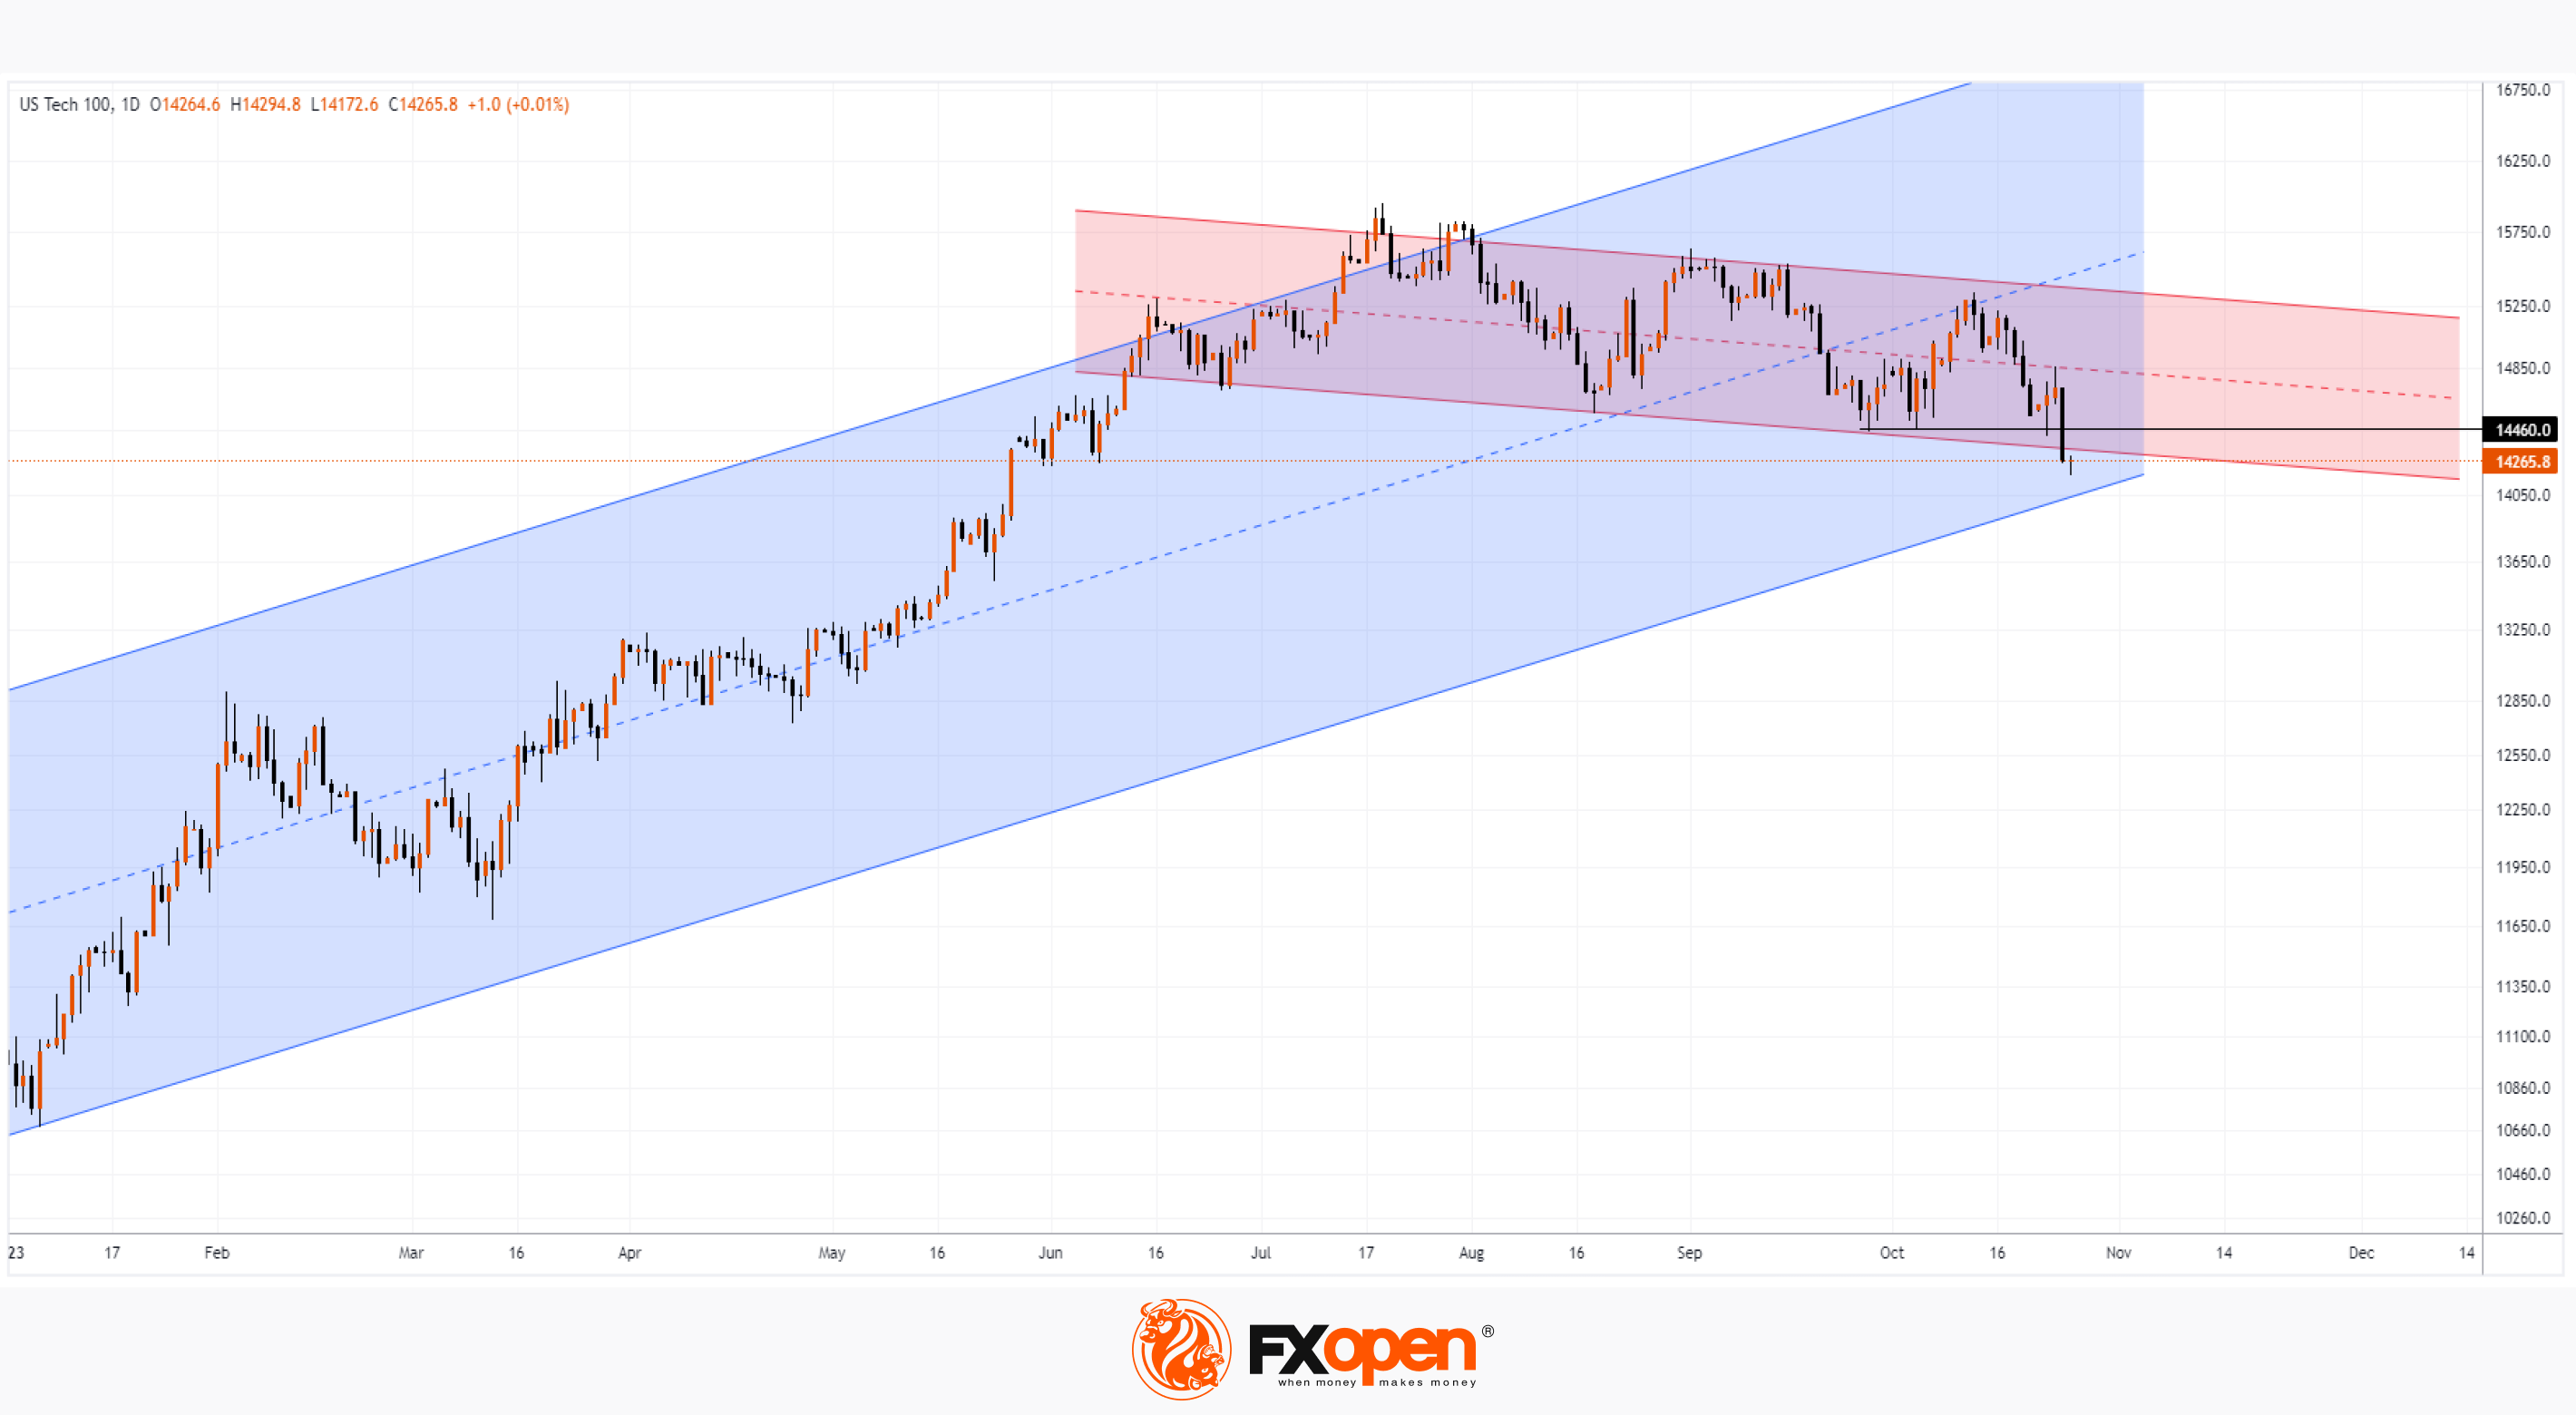
Time will tell how the correction that has begun will fit into the statistics. The chart shows that the median line of the downward channel, shown in red, is already exerting pressure, as can be seen from the price action on October 24th.
So far, the index price is close to the lower boundary of the ascending channel, shown in blue, which describes the prevailing bullish trend; within its framework, the NASDAQ price was able to rise by more than 45% in less than 7 months this year. So the correction looks really appropriate.
In the near future, we may witness the formation of fluctuations caused by the support of the lower border of the blue channel and the current bearish sentiment. Growth may be resisted by the level of 14,460, which acted as support in September.
The AAPL report (expected next week), as well as geopolitical news, will have an important impact.
Trade global index CFDs with zero commission and tight spreads (additional fees may apply). Open your FXOpen account now or learn more about trading index CFDs with FXOpen.
This article represents the opinion of the Companies operating under the FXOpen brand only. It is not to be construed as an offer, solicitation, or recommendation with respect to products and services provided by the Companies operating under the FXOpen brand, nor is it to be considered financial advice.
Stay ahead of the market!
Subscribe now to our mailing list and receive the latest market news and insights delivered directly to your inbox.


Latest articles

European Currencies Decline: Pound Hits New Lows, Euro Under Pressure
European currencies continue to weaken against the US dollar amid rising geopolitical tensions and increased demand for safe-haven and liquid assets. Market participants are reducing exposure to riskier instruments, putting pressure on both the euro and the pound. Additional support

Market Analysis: GBP/USD Dips Further As EUR/GBP Regains Traction
GBP/USD failed to climb above 1.3500 and corrected some gains. EUR/GBP started a decent increase and might aim for more gains above 0.8700.
Important Takeaways for GBP/USD and EUR/GBP Analysis Today
· The British Pound
