


FXOpen

This morning, the Japanese currency weakened to 142.25 yen per US dollar for the first time since November 2022.
This is a consequence of the difference in the monetary policies of the two countries. Last week, the Fed, although it paused in raising the rate, said that it could be raised before the end of the year. On the other hand, the Bank of Japan on Friday maintained its commitment to ultra-soft monetary policy.
The USD/JPY chart shows that the rate is moving within a long-term ascending channel (shown in blue), and today it is near its median line — it can serve as resistance, which can at least slow down the growth of the rate. Or even promote a pullback within the channel shown in yellow.
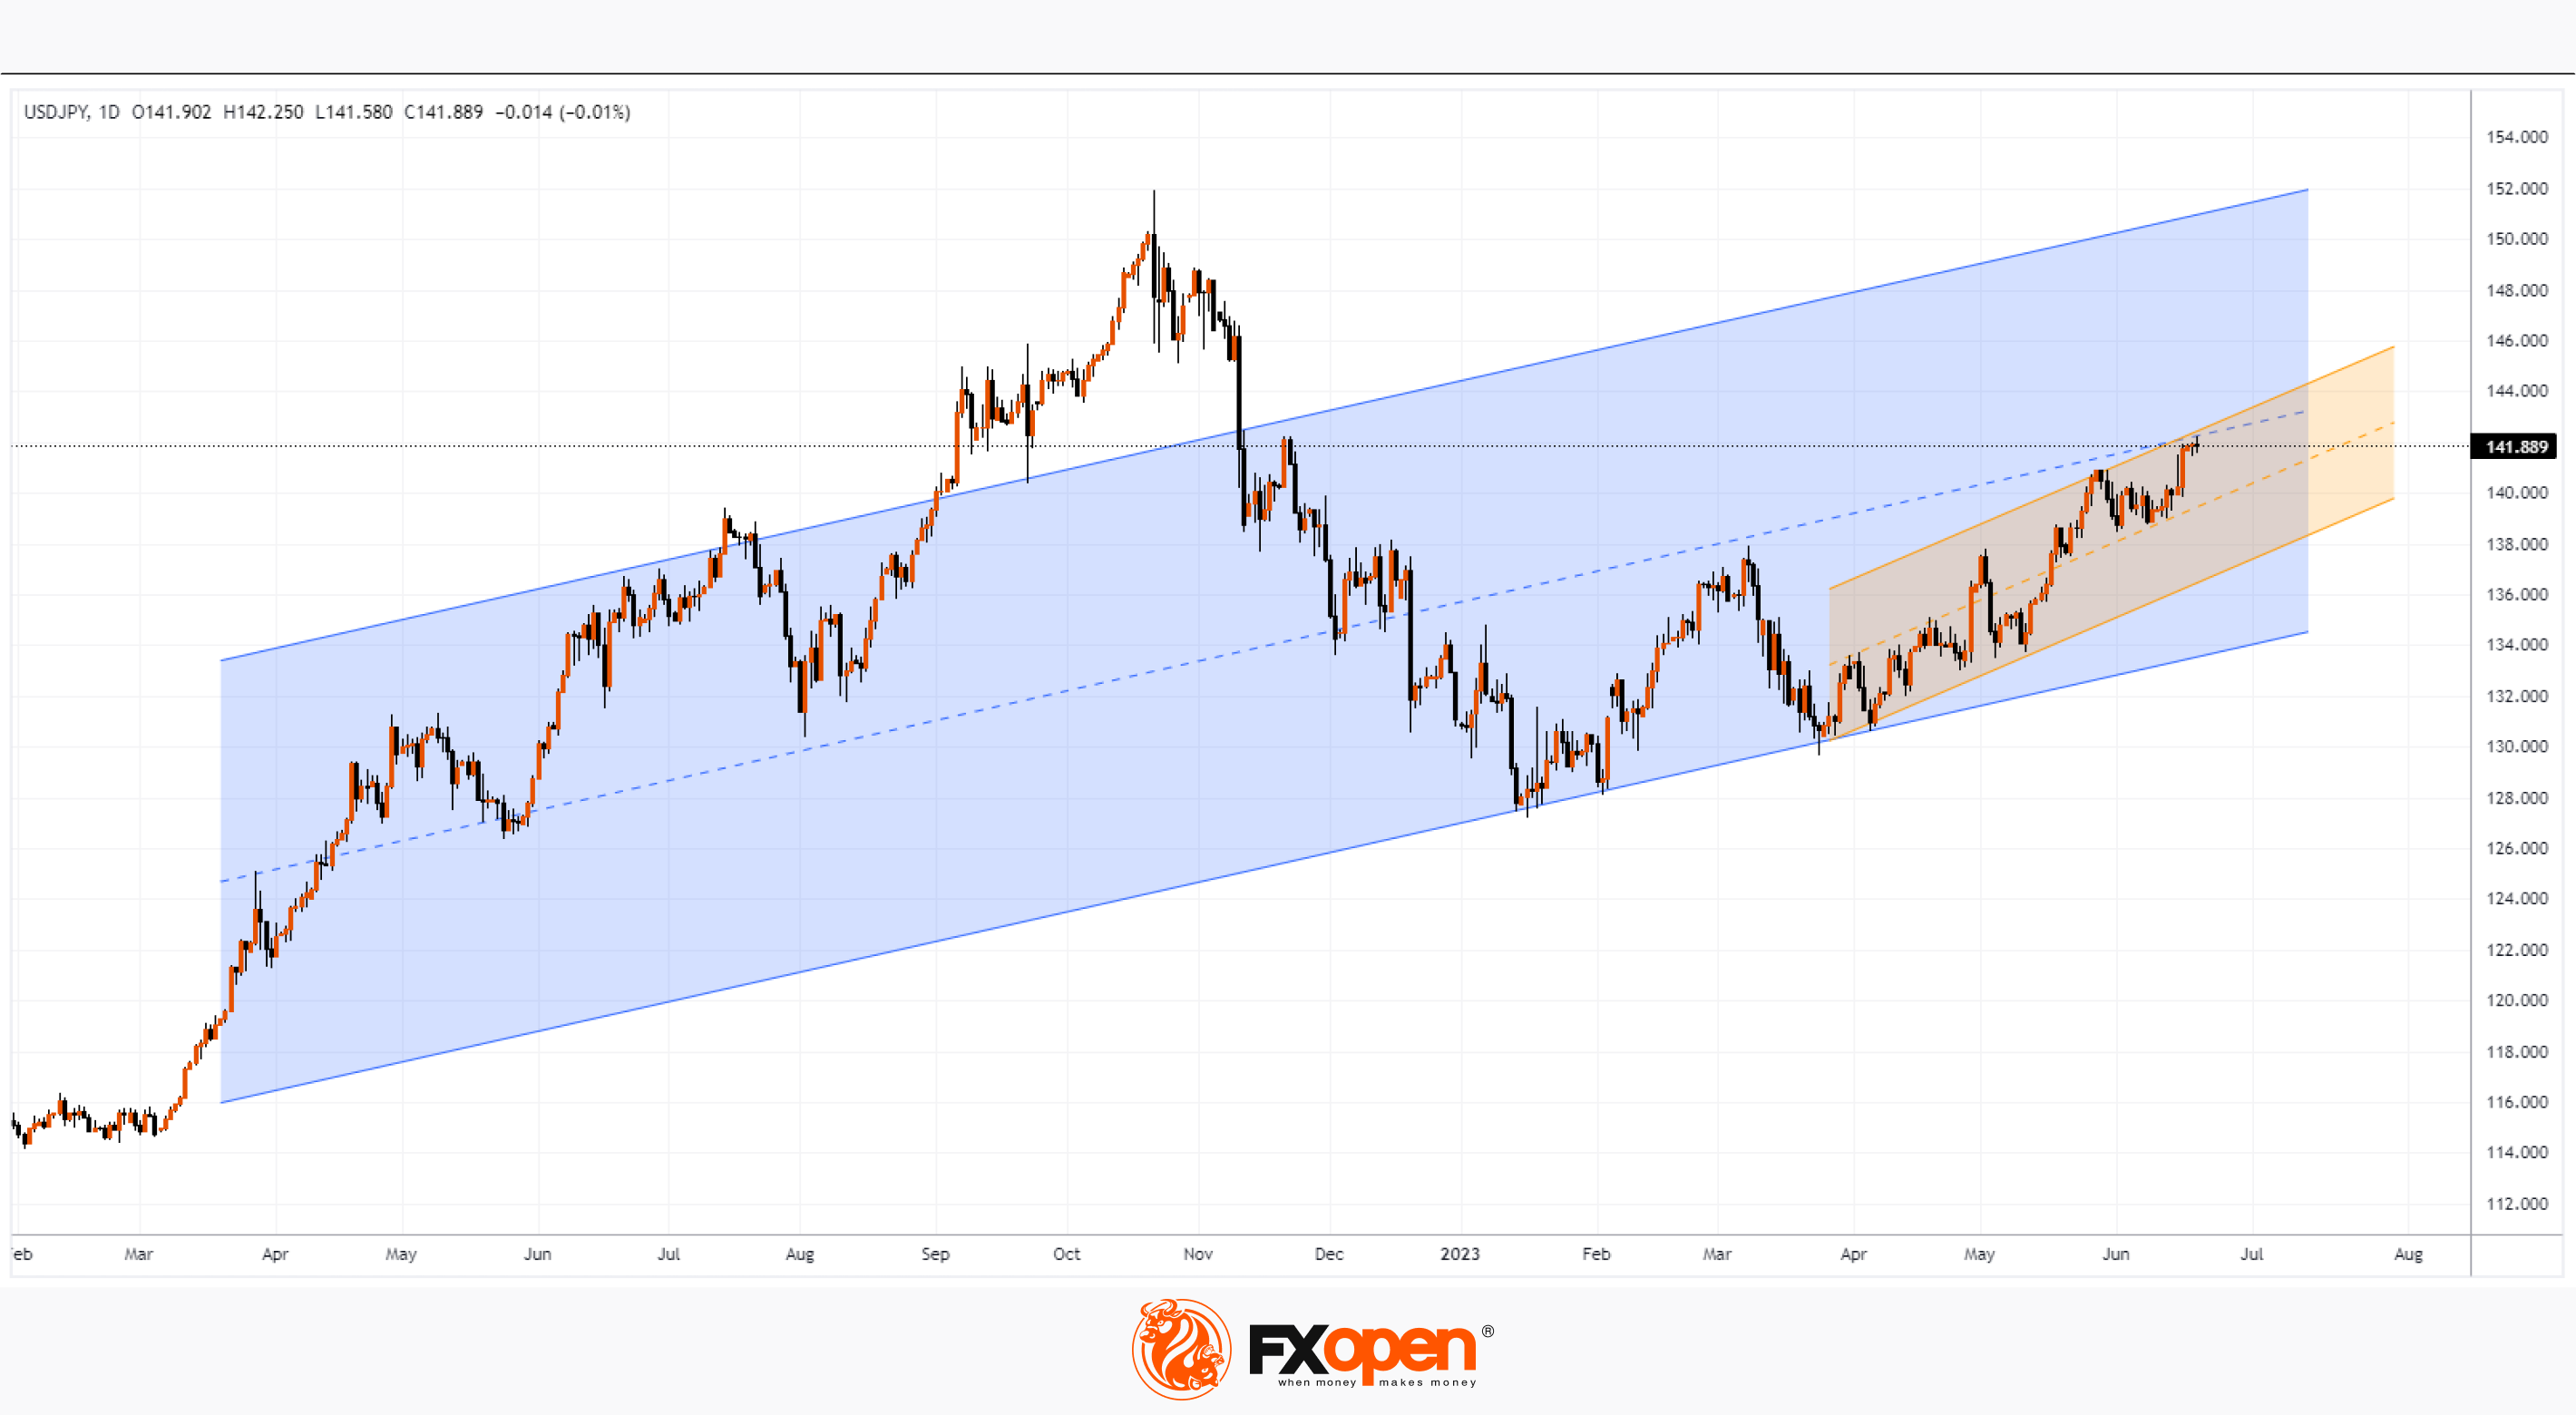
However, the series of higher lows that has been going on since March 2023 suggests that bulls are dominating the USD/JPY market and may be trying to break the median line.
Trade over 50 forex markets 24 hours a day with FXOpen. Take advantage of low commissions, deep liquidity, and spreads from 0.0 pips (additional fees may apply). Open your FXOpen account now or learn more about trading forex with FXOpen.
This article represents the opinion of the Companies operating under the FXOpen brand only. It is not to be construed as an offer, solicitation, or recommendation with respect to products and services provided by the Companies operating under the FXOpen brand, nor is it to be considered financial advice.
Stay ahead of the market!
Subscribe now to our mailing list and receive the latest market news and insights delivered directly to your inbox.


Latest articles

Consolidation Ahead of NFP: Commodity Currencies Search for Direction
Commodity-linked currencies have entered a consolidation phase following recent directional moves, as market participants adopt a wait-and-see approach ahead of key US labour market data. Current price action reflects a balance between ongoing demand for the US dollar and attempts

The Real Driver Behind the Dollar Rally: Market Insights with Gary Thomson
The US dollar has been firm, but the drivers behind the move may be more complex than they first appear.
While geopolitical tension and shifts in risk sentiment play a role, current price behaviour seems increasingly influenced by inflation expectations

EUR/USD and USD/CHF Pull Back: Market Reacts to Fundamentals
European currencies have shown a recovery in recent trading sessions after their recent decline, displaying early signs of a reversal. The US dollar is weakening amid expectations surrounding upcoming US macroeconomic data, while market participants are reassessing their short-term positions