


FXOpen

Since the beginning of 2021, META and TSLA shares have seemingly been in competition with each other. Either the price of META is higher than the price of TSLA, or vice versa. The turn has come to the rivalry of the CEOs, in the literal sense.
It started when Zuckerberg announced the idea to create a competitor to Twitter. Musk probably didn’t like it, and in response he offered to fight. Zuckerberg accepted the challenge, asking him to name a venue. Musk chose an arena in Vegas as the venue for the fight.
Musk has a size advantage, and according to him, he has experience in tough street fights in South Africa. Zuckerberg has an age advantage as well as a jiu-jitsu belt.
In anticipation of the battle of billionaires, it is worth paying attention to the META stock chart.
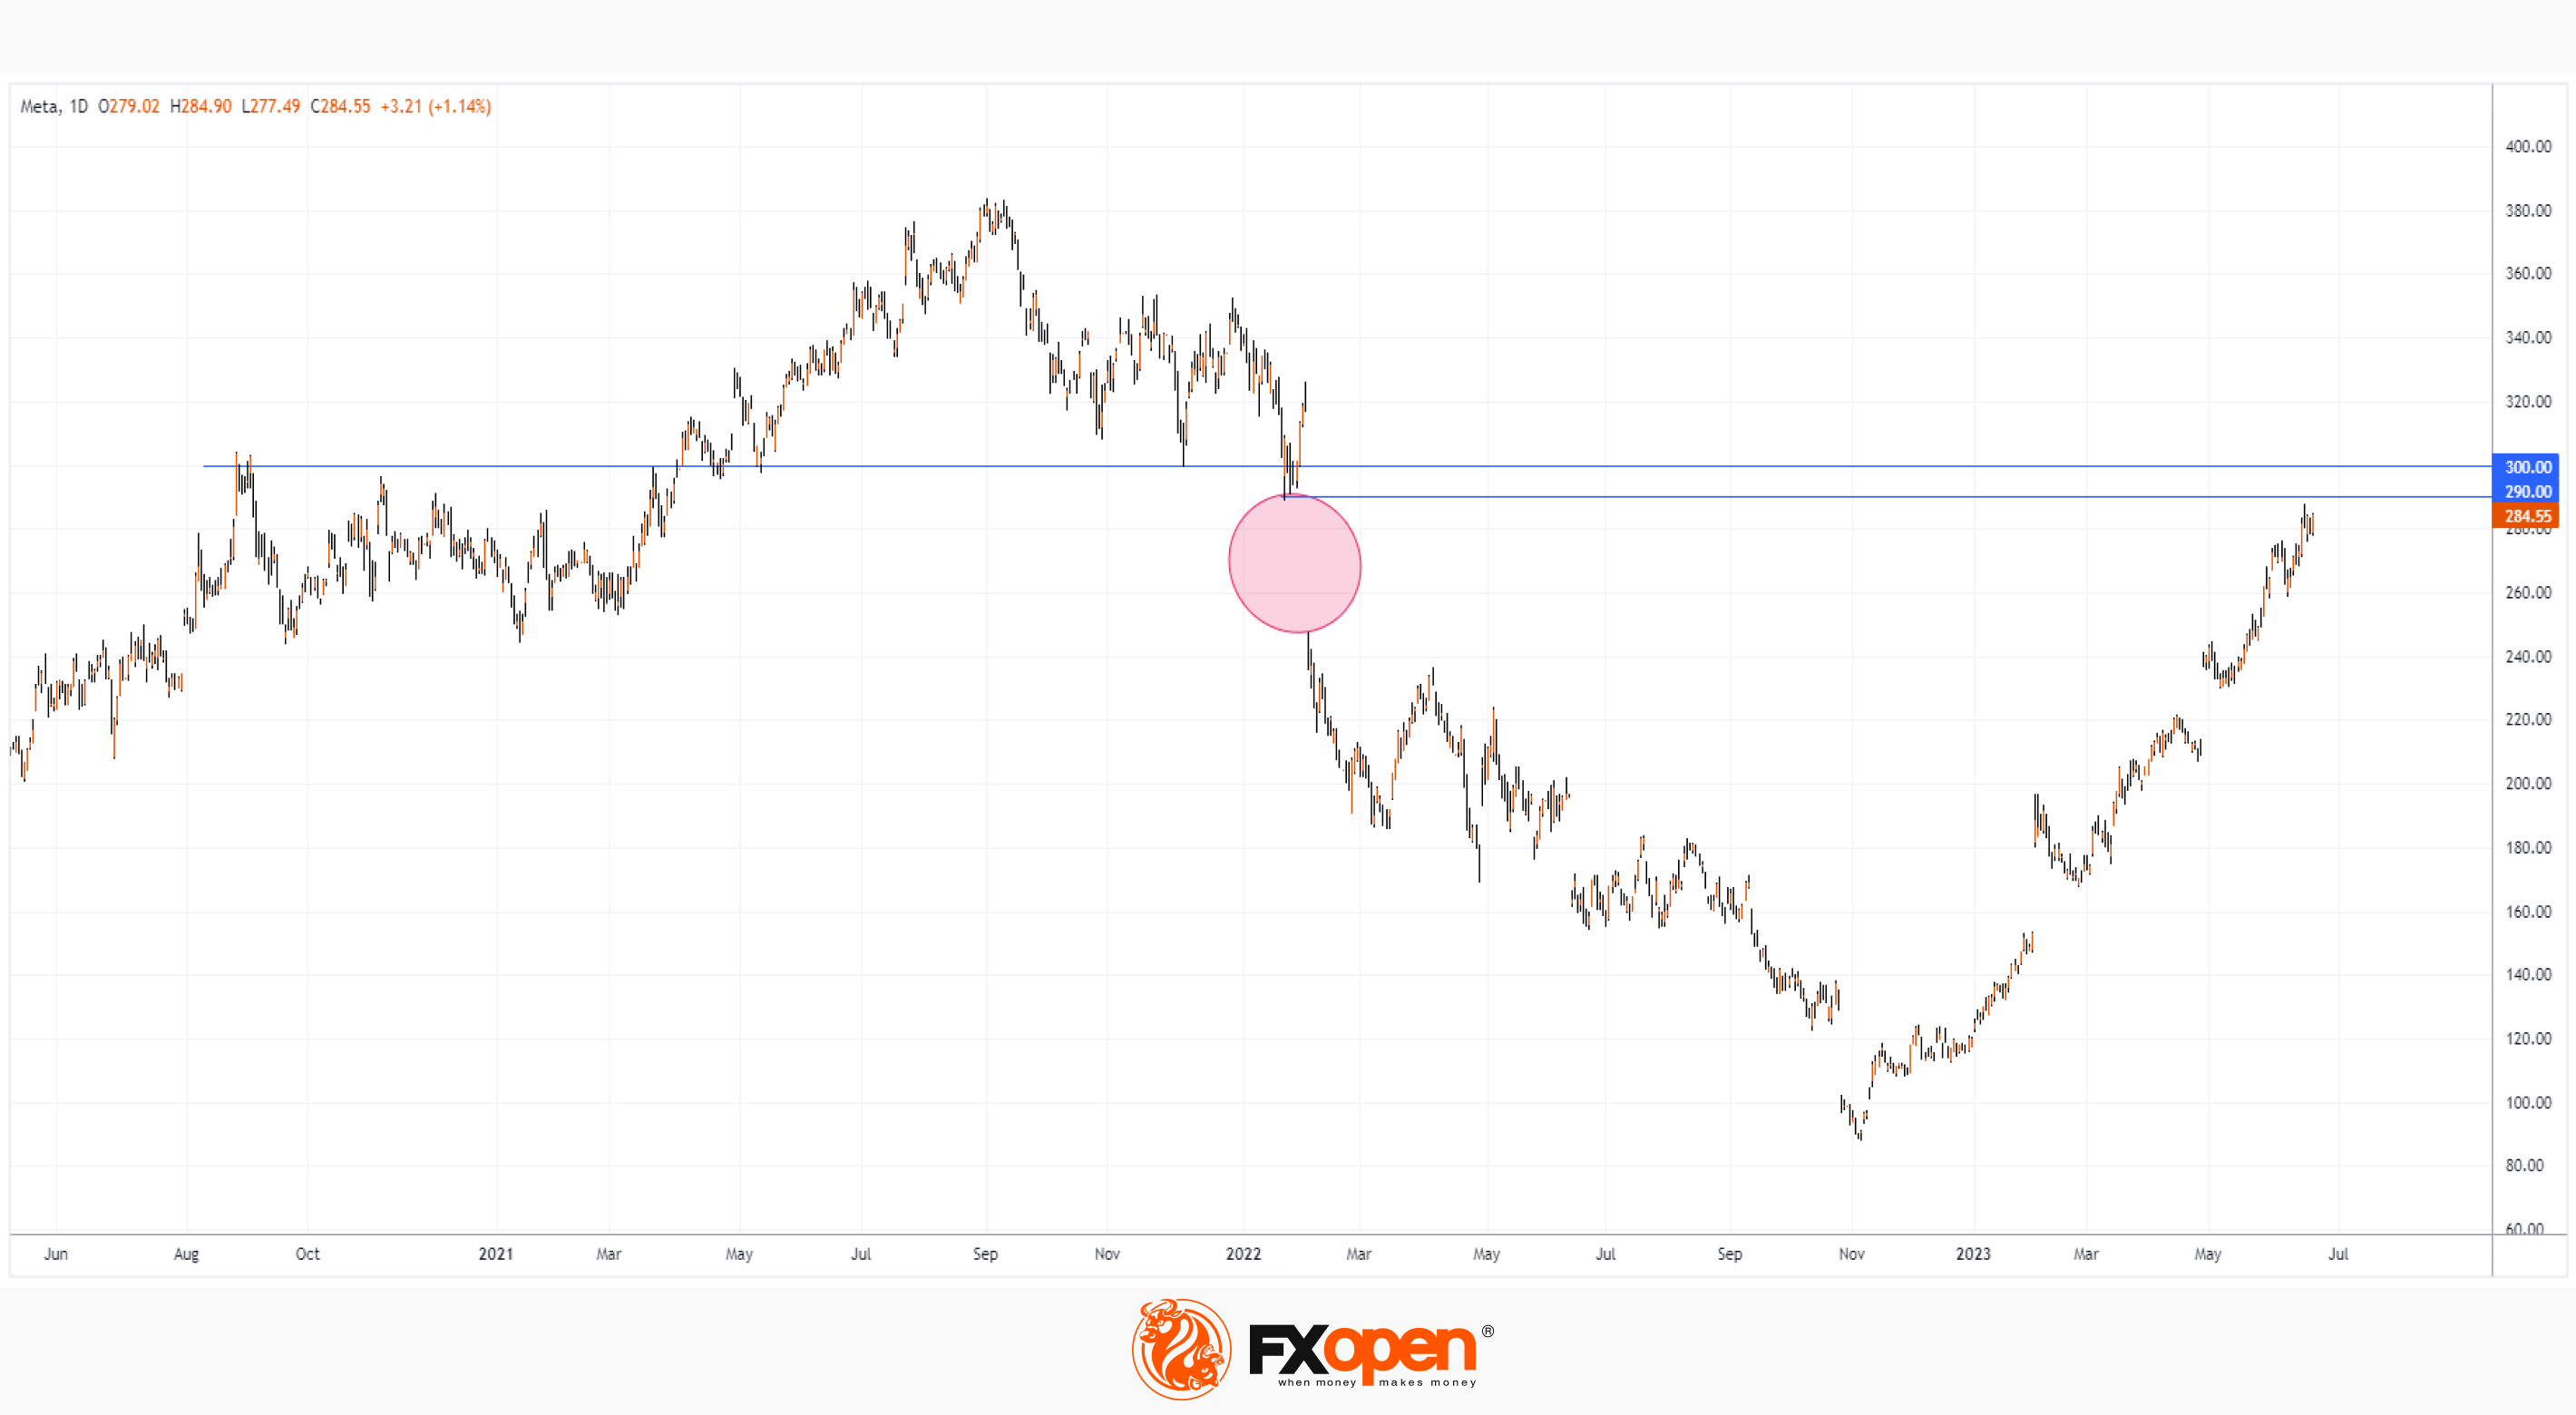
The price of META is near the level of USD 290 per share, which practically means the closing of the gap that formed in 2022. Also, the price of META shares is near the psychological mark of USD 300 – it has influenced the price more than once since 2021. So the 290-300 resistance area may well contribute to the start of a correction for the META share price, which has risen by more than 140% since the beginning of the year.
Buy and sell stocks of the world's biggest publicly-listed companies with CFDs on FXOpen’s trading platform. Open your FXOpen account now or learn more about trading share CFDs with FXOpen.
This article represents the opinion of the Companies operating under the FXOpen brand only. It is not to be construed as an offer, solicitation, or recommendation with respect to products and services provided by the Companies operating under the FXOpen brand, nor is it to be considered financial advice.
Stay ahead of the market!
Subscribe now to our mailing list and receive the latest market news and insights delivered directly to your inbox.


Latest articles

Dollar Index (DXY) Hits Yearly High
Today, the dollar index rose above last week’s peak around the 99.68 level, setting a new high for 2026. This movement is supported by a tense fundamental backdrop:
→ Inflationary pressures from rising oil prices. Markets may be pricing

WTI Oil Price Rises Above $100
Another shocking Monday for the energy market. Last week’s start was remembered for a bullish gap of more than 10% (which was later followed by a pullback), but today’s market open proved even more volatile (as reflected by

Market Analysis: AUD/USD and NZD/USD Struggle as Market Jitters Shake Risk Sentiment
AUD/USD failed to stay in a positive zone and declined below 0.7000. NZD/USD is also moving lower and might extend losses below 0.5850.
Important Takeaways for AUD/USD and NZD/USD Analysis Today
· The Aussie Dollar