


Meta Platforms (META) Shares Dip Below $550
FXOpen

On 7 October, we analysed the Meta Platforms (META) price chart and highlighted:
→ The formation of a long-term upward channel (marked in blue).
→ The key drivers supporting bullish sentiment.
We also emphasised the psychological significance of the $600 level.
Since then, the price has approached this level four times, only to be met with resistance each time (indicated by red arrows).
Yesterday, for the first time since mid-September, META’s price fell below $550, suggesting that the stock underperformed the broader market during October and November.
What’s Next?
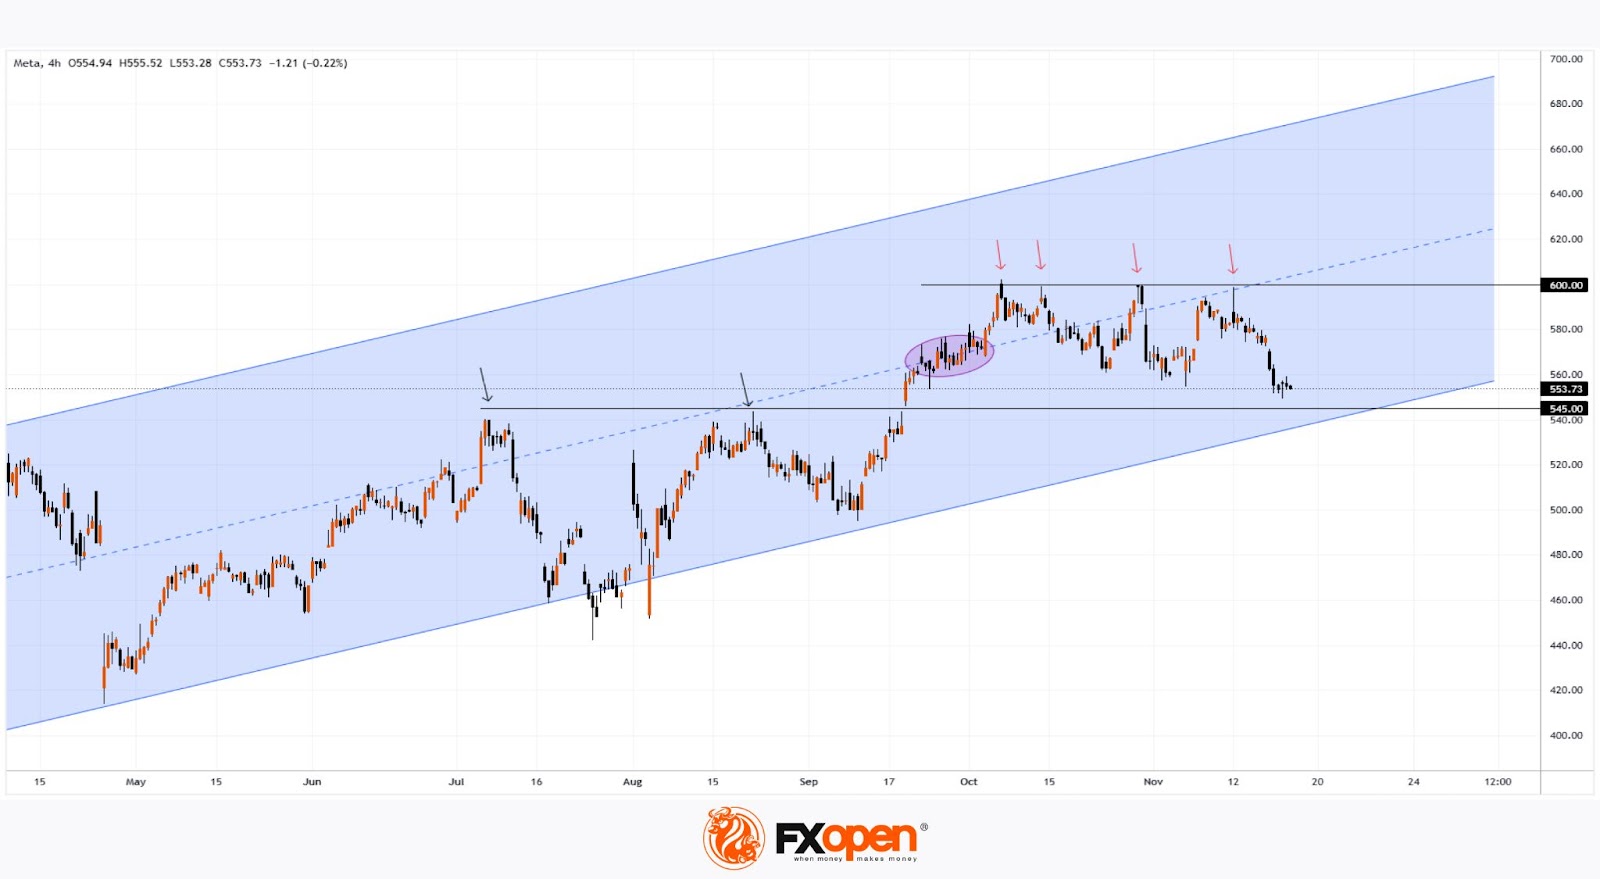
Technical analysis of the META price chart reveals that the stock is trading within a range defined by:
→ Resistance at $600, which has consistently proven robust.
→ Support at $545, a level that previously acted as resistance (marked by arrows).
While the channel median initially acted as a “magnet” for the price (highlighted with an oval), November patterns suggest the median now "repels" the price downward, a bearish indicator.
Bullish momentum might regain strength if the price approaches the lower boundary of the blue channel. However, the sustainability of demand at these levels and whether it can drive a successful breakout above $600 remains uncertain.
Analysts remain optimistic. According to a TipRanks survey:
→ 40 out of 44 analysts recommend buying META shares.
→ The average 12-month price target for META is $662.
Buy and sell stocks of the world's biggest publicly-listed companies with CFDs on FXOpen’s trading platform. Open your FXOpen account now or learn more about trading share CFDs with FXOpen.
This article represents the opinion of the Companies operating under the FXOpen brand only. It is not to be construed as an offer, solicitation, or recommendation with respect to products and services provided by the Companies operating under the FXOpen brand, nor is it to be considered financial advice.
Stay ahead of the market!
Subscribe now to our mailing list and receive the latest market news and insights delivered directly to your inbox.


Latest articles

AUD/CAD: Months of Indecision — Is a Breakout Finally Coming?
The Australian dollar has clawed back most of its end-of-June losses, when it touched three-month lows against the greenback amid escalating Middle East tensions. Since then, sentiment has improved: the RBA's Assistant Governor Sarah Hunter signalled the board stands ready

USD/JPY: Battling at the Top of the Triangle
On 3 July, Japan's Finance Minister, Satsuki Katayama, stated that the Ministry of Finance remains in close contact with US authorities regarding developments in USD/JPY as the yen traded near its weakest level in almost 40 years. Similar verbal

Dow Jones (DJIA): Consolidation Beyond the Trend
Federal Reserve Chair Kevin Warsh testified before Congress on 14–15 July, reaffirming the Fed's commitment to bringing inflation back to target while providing no clear guidance on the future path of interest rates. Meanwhile, June inflation data came in