


Meta Platforms (META) Shares Hold Steady After Mishap
FXOpen

An awkward moment occurred at the Meta Connect 2025 product presentation, where Mark Zuckerberg showcased innovations but ran into technical glitches:
→ The AI assistant built into the Ray-Ban Display smart glasses froze;
→ The neural bracelet, designed to control the interface with gestures, failed to answer a video call.
News of the mishap quickly spread across social media, with the blame for the issues pinned on Wi-Fi. Despite the reputational blow, META shares showed resilience. This suggests that investors are focusing on deeper, fundamental factors, including the potential of augmented reality and the social media giant’s drive for greater efficiency.
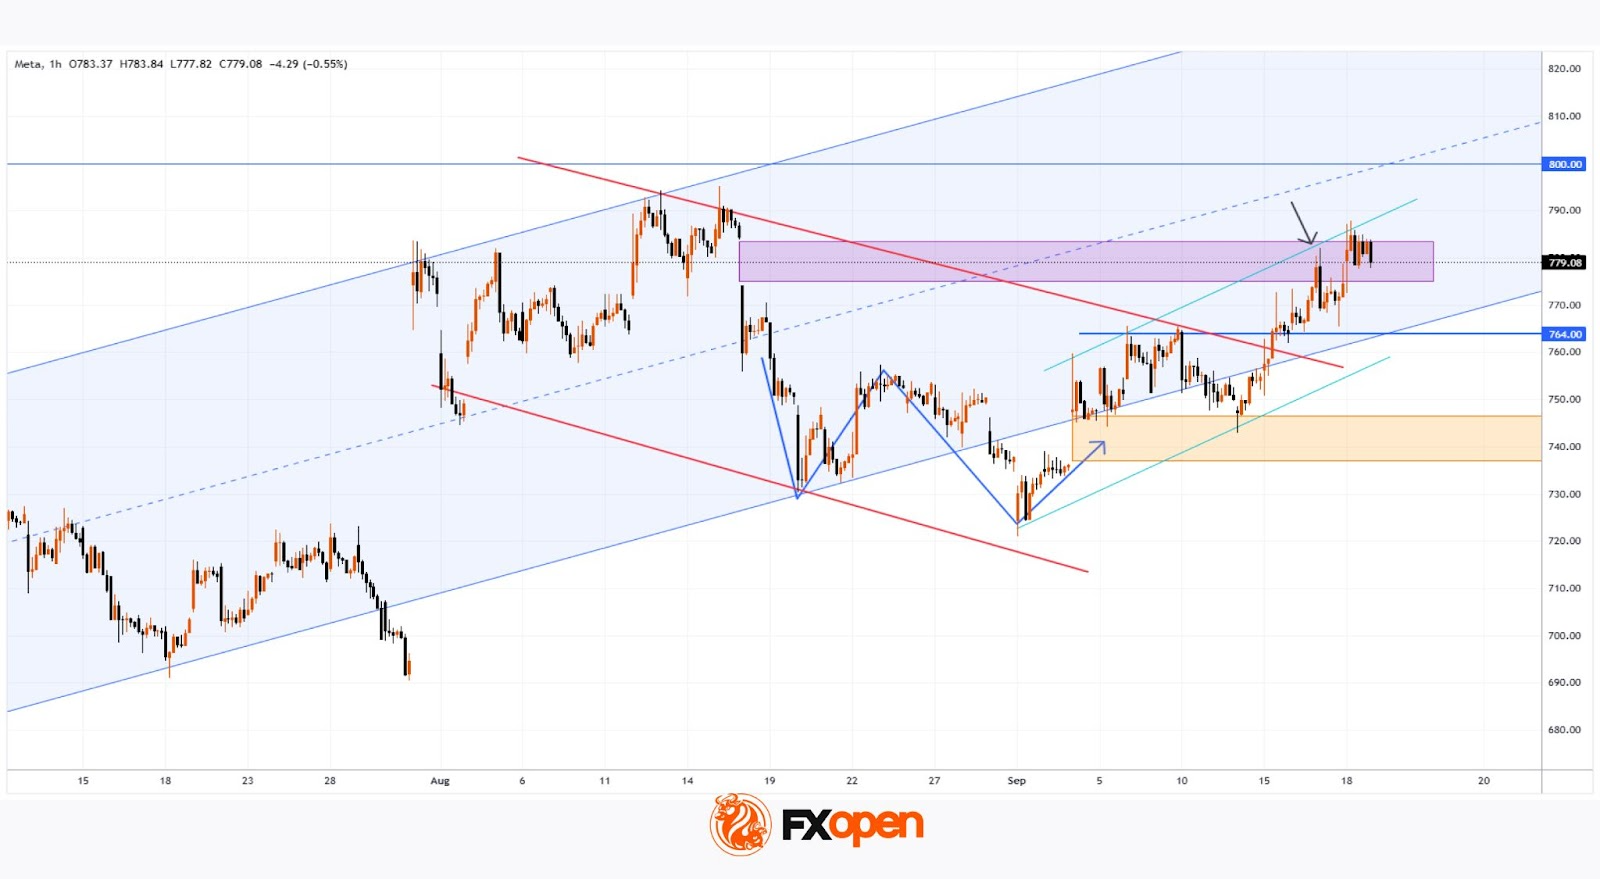
Technical Analysis of META Chart
Analysing META’s chart a month ago, we:
→ Drew an ascending channel and a resistance area from the bearish gap (shown in purple);
→ Noted that the price was around its median;
→ Listed bearish signals and suggested a correction, pointing out that in such a case bulls might step in at support around $747 or the channel’s lower boundary.
Indeed, since then (as shown by the dashed arrow):
→ The price fell to the channel’s lower boundary and then rebounded (confirming bullish activity);
→ A bearish breakout attempt failed, and the price returned to the channel, forming a bullish gap (shown in yellow), which acted as support on 12 September.
How Might the Price Move Next?
From a bullish perspective:
→ The ascending channel remains valid, while the price is holding within a steeper growth channel (highlighted in turquoise).
→ The $764 level has switched its role from resistance to support.
→ As shown by the red lines, META’s price action over the past two months can be viewed as a large bullish flag (a corrective pattern within an uptrend) with the potential for trend continuation.
From a bearish perspective:
→ Pressure may come from the psychological $800 per share level.
→ The bearish gap area acts as resistance, as indicated by the black arrow.
→ It is possible that if the price falls below the channel’s lower boundary, the median could act as resistance.
Taking all of this into account, we could assume that bullish sentiment (supported by the Fed’s rate cut) may persist, although the $790–800 area appears to be a key obstacle for META shares.
Buy and sell stocks of the world's biggest publicly-listed companies with CFDs on FXOpen’s trading platform. Open your FXOpen account now or learn more about trading share CFDs with FXOpen.
This article represents the opinion of the Companies operating under the FXOpen brand only. It is not to be construed as an offer, solicitation, or recommendation with respect to products and services provided by the Companies operating under the FXOpen brand, nor is it to be considered financial advice.
Stay ahead of the market!
Subscribe now to our mailing list and receive the latest market news and insights delivered directly to your inbox.


Latest articles

CAD/JPY: The Yen's Most Historic Move in 30 Years Meets a Fragile Support
Two central banks are heading in genuinely opposite directions this week, and the tension is unmistakable. The Bank of Canada held rates steady at 2.25% on September 2, with a mildly hawkish tilt as policymakers acknowledged a broadening economic

USD/JPY and USD/CAD Await Key Fed Decision
The US dollar is consolidating against the yen and Canadian dollar ahead of the key event of the week — the Federal Reserve meeting. The Fed is widely expected to raise its policy rate by 25 basis points to a range

UnitedHealth: Fundamentals Are Healing, Now the Chart Must Agree
UnitedHealth finds itself in a genuinely split narrative right now, trading near $388, down about 15.9% from its 52-week high, even as the fundamental picture keeps improving. Q2 earnings beat expectations, with revenue of $112.03 billion, and the