


FXOpen

Just yesterday, META's stock price closed at USD 493.50, up approximately 40% since the start of 2024 and up nearly 300% since the start of 2023.
However, following the release of Meta's quarterly report, its shares plummeted to USD 400 in post-market trading, representing a decline of more than -15%.
It is noteworthy that the report exceeded expectations in some of the main indicators:
→ earnings per share: actual = USD 4.70, forecast = USD 4.32;
→ revenue: actual = USD 36.4 billion, forecast = USD 36.1 billion.
However, investors were disappointed by plans for the coming months, as Meta said second-quarter revenue would be between USD 36.5 billion and USD 39 billion, below the average estimate of USD 38.24 billion. This could be due to increased investment in developing AI-based products , which do not yet generate income.
At pre-market today, the META share price is around USD 418.
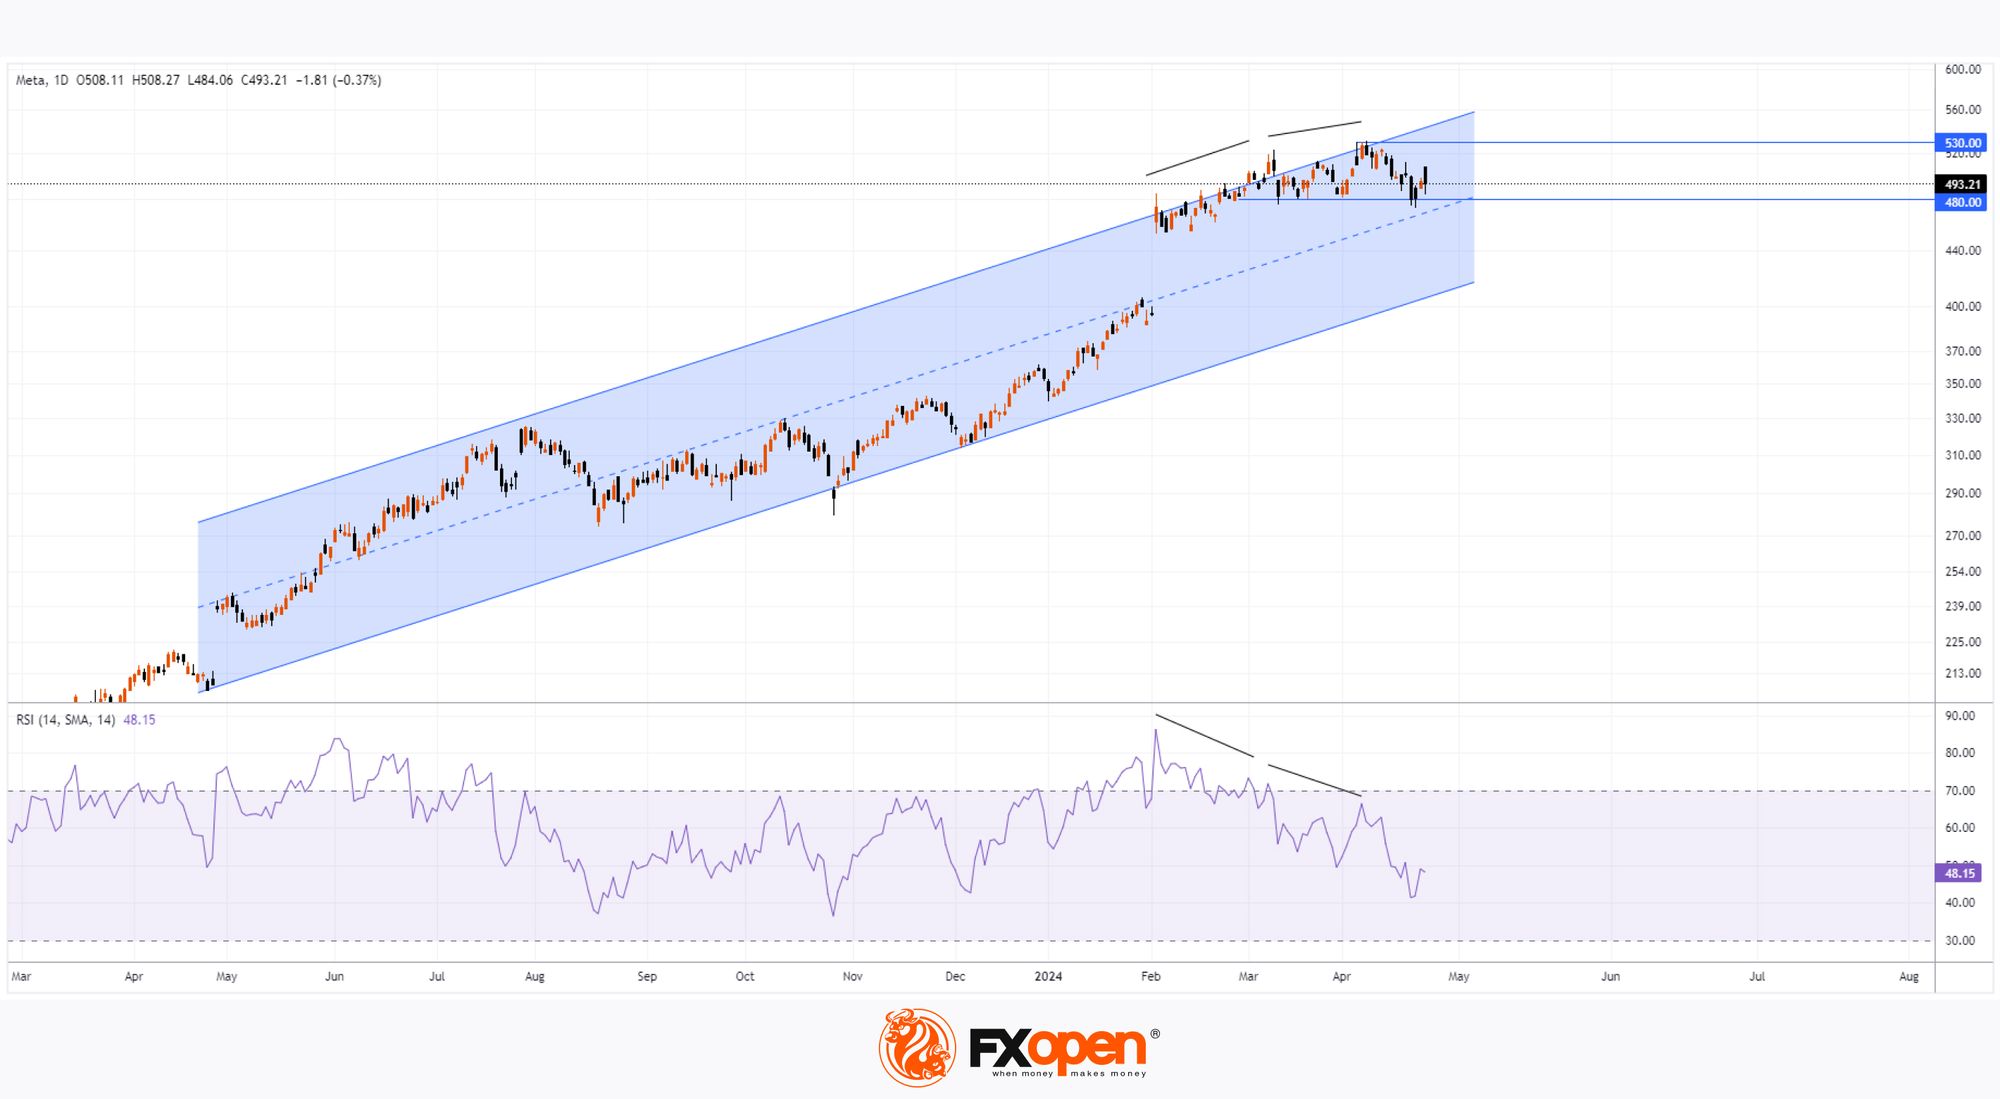
The technical analysis of the META stock chart shows:
→ The price still remains within the long-term ascending channel (marked in blue), which describes the price increase in 2023-2024.
→ The pattern of decline from the high around USD 530 towards the lower boundary may be a sign that indicates a potential change in sentiment - optimism is not endless.
→ Divergence on the RSI indicator turned out to be an effective warning for a price decline.
Market participants who bought META stock at prices between USD 480 and USD 530 will find their positions in the red when trading opens today, most likely with a bearish gap — somewhere around the lower boundary of the mentioned channel. So it is safe to assume that any rise in price towards the specified range will represent an opportunity for them to exit the position and minimize losses, which in turn will put pressure on potential attempts by the bulls to resume the multi-month trend. Resistance may also come from the median line of the channel, which today lies right at the lower limit of the range between USD 480 and USD 530.
Buy and sell stocks of the world's biggest publicly-listed companies with CFDs on FXOpen’s trading platform. Open your FXOpen account now or learn more about trading share CFDs with FXOpen.
This article represents the opinion of the Companies operating under the FXOpen brand only. It is not to be construed as an offer, solicitation, or recommendation with respect to products and services provided by the Companies operating under the FXOpen brand, nor is it to be considered financial advice.
Stay ahead of the market!
Subscribe now to our mailing list and receive the latest market news and insights delivered directly to your inbox.


Latest articles

Consolidation Ahead of NFP: Commodity Currencies Search for Direction
Commodity-linked currencies have entered a consolidation phase following recent directional moves, as market participants adopt a wait-and-see approach ahead of key US labour market data. Current price action reflects a balance between ongoing demand for the US dollar and attempts

The Real Driver Behind the Dollar Rally: Market Insights with Gary Thomson
The US dollar has been firm, but the drivers behind the move may be more complex than they first appear.
While geopolitical tension and shifts in risk sentiment play a role, current price behaviour seems increasingly influenced by inflation expectations

EUR/USD and USD/CHF Pull Back: Market Reacts to Fundamentals
European currencies have shown a recovery in recent trading sessions after their recent decline, displaying early signs of a reversal. The US dollar is weakening amid expectations surrounding upcoming US macroeconomic data, while market participants are reassessing their short-term positions