


Microsoft (MSFT) Stock Hits a 4.5-Month High
FXOpen

On 31 October, our analysis of Microsoft (MSFT) stock highlighted:
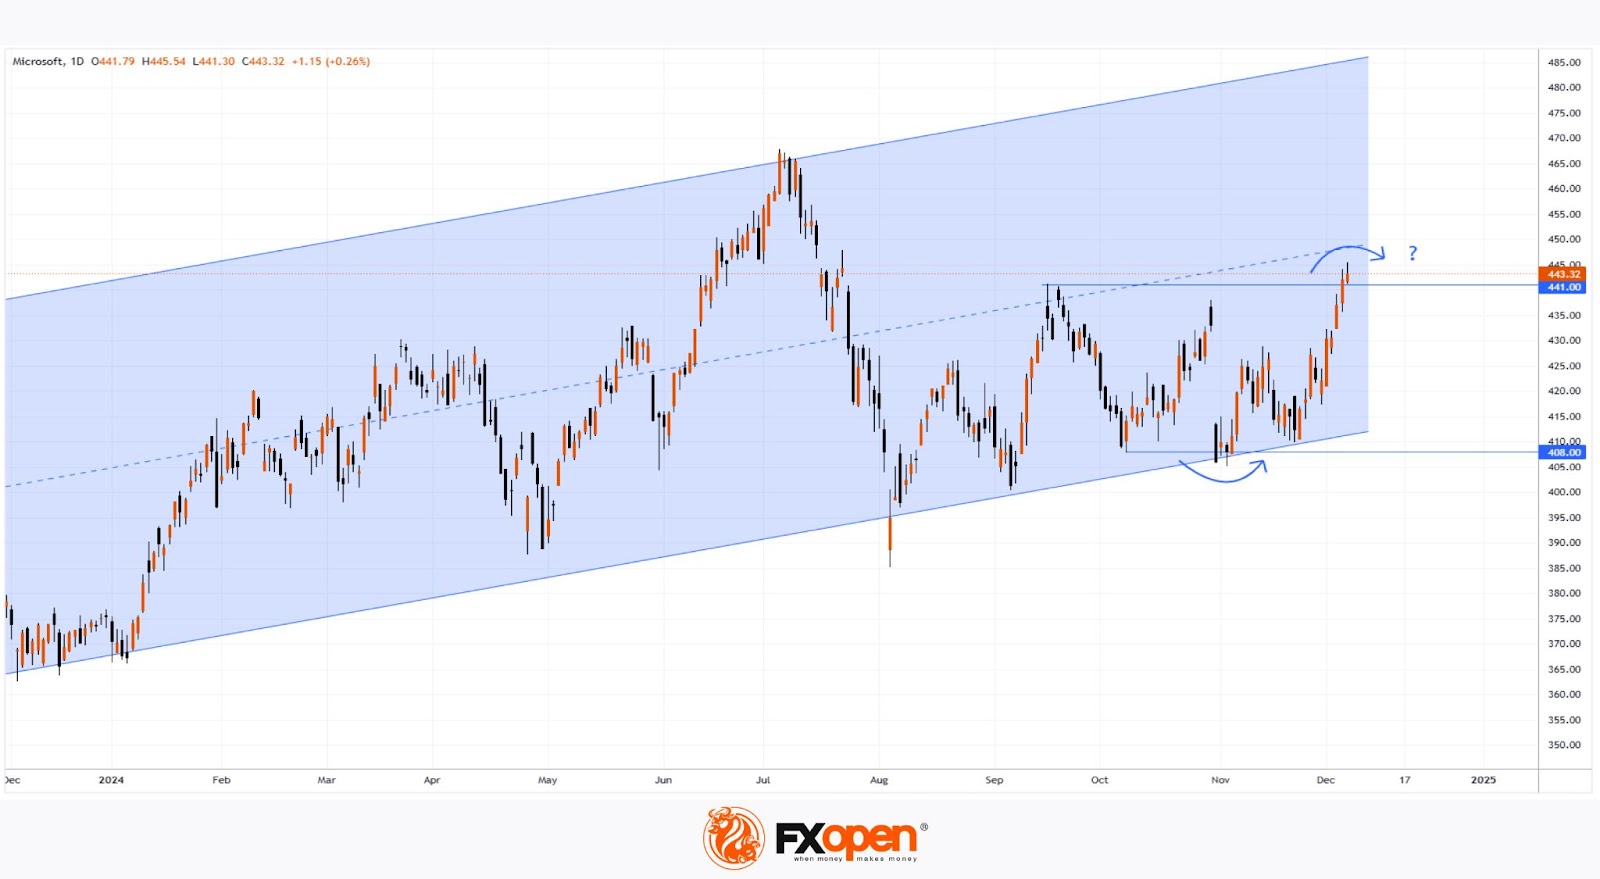
→ The price is forming a long-term upward channel, illustrated in blue.
→ The channel’s lower boundary serves as a significant support level.
On Friday, MSFT stock climbed to $445, its highest level since mid-July, buoyed by news that OpenAI may grant Microsoft access to key AI-related technologies.
Will the Price Continue to Rise?
There are reasons to suspect that the bullish momentum may not sustain.
Technical analysis of MSFT’s chart today suggests:
→ The price is near the median of the long-term channel, and this median could act as resistance. This is hinted at by the long upper shadows on Thursday and Friday’s candles.
→ The emerging bullish breakout above the September high around $441 might prove to be a false breakout, similar to the false bearish breakout of early October support near $408 (highlighted with arrows).
Additionally, Microsoft’s stock has underperformed compared to market indices, which are at historic highs. This could mean the price may retrace to $430 or lower, aligning more closely with average autumn levels.
Analysts, however, remain optimistic about MSFT’s prospects. According to TipRanks:
→ 26 out of 29 analysts recommend buying MSFT stock.
→ The average 12-month price target for MSFT is $497.
Buy and sell stocks of the world's biggest publicly-listed companies with CFDs on FXOpen’s trading platform. Open your FXOpen account now or learn more about trading share CFDs with FXOpen.
This article represents the opinion of the Companies operating under the FXOpen brand only. It is not to be construed as an offer, solicitation, or recommendation with respect to products and services provided by the Companies operating under the FXOpen brand, nor is it to be considered financial advice.
Stay ahead of the market!
Subscribe now to our mailing list and receive the latest market news and insights delivered directly to your inbox.


Latest articles

AUD/CAD: Months of Indecision — Is a Breakout Finally Coming?
The Australian dollar has clawed back most of its end-of-June losses, when it touched three-month lows against the greenback amid escalating Middle East tensions. Since then, sentiment has improved: the RBA's Assistant Governor Sarah Hunter signalled the board stands ready

USD/JPY: Battling at the Top of the Triangle
On 3 July, Japan's Finance Minister, Satsuki Katayama, stated that the Ministry of Finance remains in close contact with US authorities regarding developments in USD/JPY as the yen traded near its weakest level in almost 40 years. Similar verbal

Dow Jones (DJIA): Consolidation Beyond the Trend
Federal Reserve Chair Kevin Warsh testified before Congress on 14–15 July, reaffirming the Fed's commitment to bringing inflation back to target while providing no clear guidance on the future path of interest rates. Meanwhile, June inflation data came in