


Nasdaq 100 Ahead of the Holidays
FXOpen

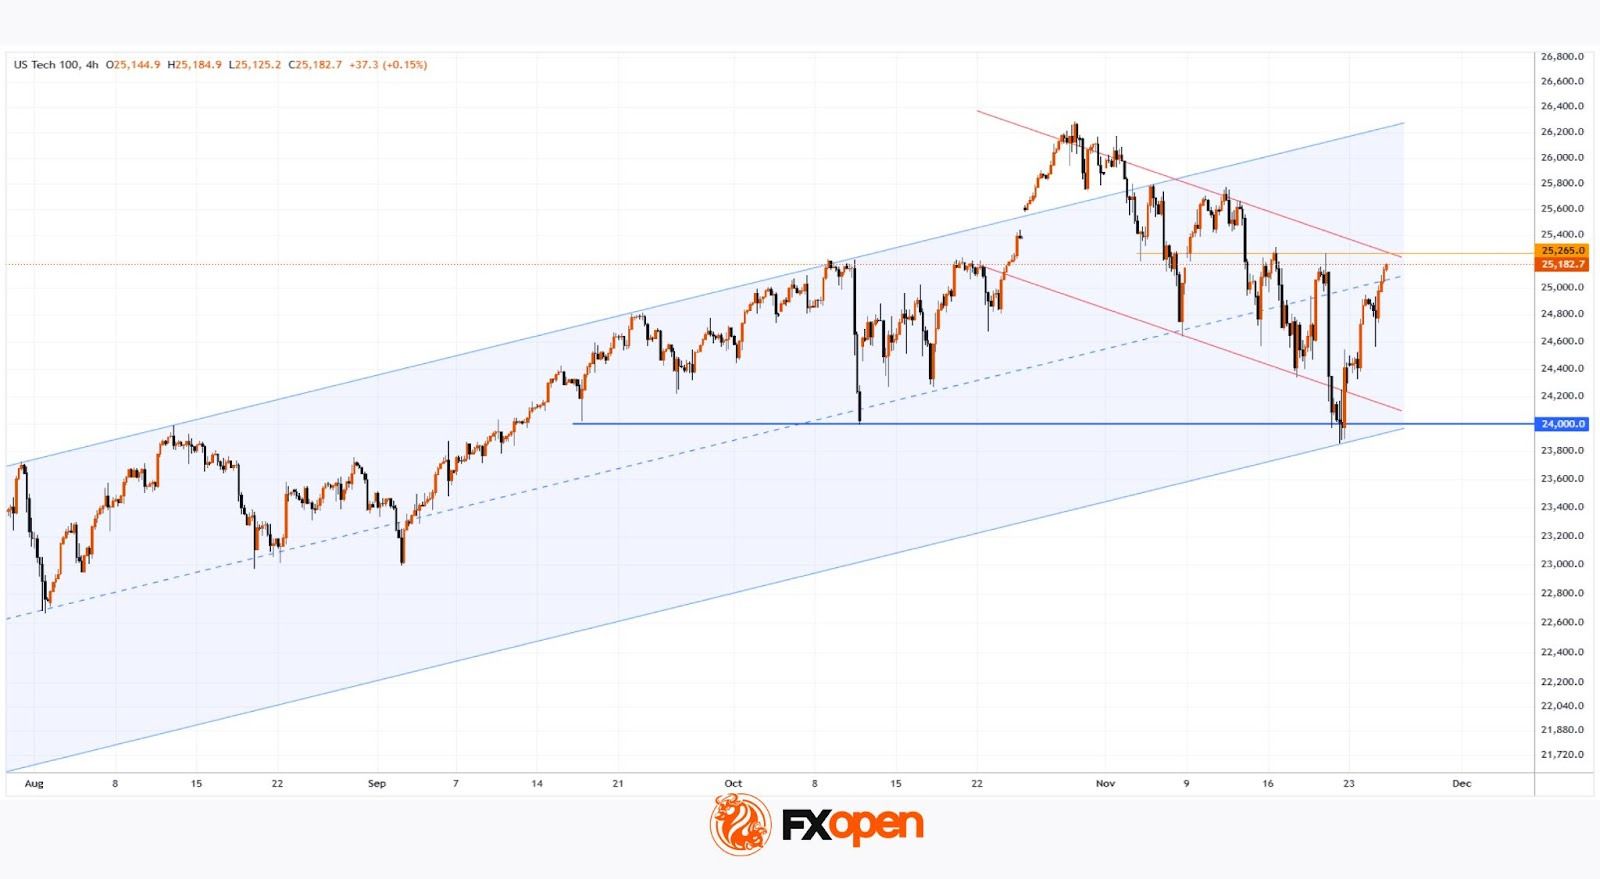
As the chart shows, the Nasdaq 100 (US Tech 100 mini on FXOpen) has rebounded from its roughly 2.5-month low recorded on 21 November. At that point, bearish sentiment was driven by fears of an “AI bubble”, expectations of higher interest rates, and other news-related pressures.
The recovery from that level was strong — in less than a week the index gained around 5.3%, signalling robust demand. This not only offsets last week’s concerns but also injects optimism into the near-term outlook.
Technical Analysis of the Nasdaq 100 Chart
Examining recent price action in the Nasdaq 100 (US Tech 100 mini on FXOpen), we can outline an ascending channel in which:
→ the median line acted as support until mid-November;
→ support at the lower boundary helped form the 21 November low.
From the perspective of buying pressure:
→ The November dip appears to be an intermediate correction within a broader emerging uptrend.
→ The brief move below the psychological 24k level (where the notable September and October lows lie) resembles a Liquidity Grab pattern, suggesting so-called Smart Money may have used sellers’ liquidity to build long positions — a sign of bullish intent.
From the perspective of selling pressure:
→ the market remains within a corrective structure (highlighted in red);
→ today, the Nasdaq 100 (US Tech 100 mini on FXOpen) is trading near 25,265, a level that acted as resistance on 17–20 November.
It is possible that trading near the channel’s median line will encourage a balance between buying and selling forces — just as market participants head off to celebrate Thanksgiving.
Trade global index CFDs with zero commission and tight spreads (additional fees may apply). Open your FXOpen account now or learn more about trading index CFDs with FXOpen.
This article represents the opinion of the Companies operating under the FXOpen brand only. It is not to be construed as an offer, solicitation, or recommendation with respect to products and services provided by the Companies operating under the FXOpen brand, nor is it to be considered financial advice.
Stay ahead of the market!
Subscribe now to our mailing list and receive the latest market news and insights delivered directly to your inbox.


Latest articles

NZD/USD Analysis: A Tug-of-War at the Critical Level
The kiwi has strengthened meaningfully against most peers this month. However, against the US dollar specifically, NZD/USD remains well below its 2026 highs, trading in the mid-0.58 area versus January's peak near 0.6075.
New Zealand's Q2 inflation

AUD/USD and USD/CAD React to Rising Geopolitical Risks
Commodity-linked currencies remain under pressure as geopolitical tensions in the Middle East continue to escalate. The United States has maintained strikes on targets in Iran, while the Tehran-backed Houthis have intensified threats to shipping in the Red Sea and near

GBP/CHF: Trendline or RSI — Which One Is Lying?
Sterling enters this week on firmer footing, with political uncertainty fading fast after Andy Burnham's confirmation as Labour leader eased investor concerns over the succession to Keir Starmer. Markets reacted further to reports pointing to Shabana Mahmood as the frontrunner