


FXOpen
The Nasdaq-100 index is holding above 18,000 today following yesterday's bullish momentum, fueled by inflation news.
The PCE consumer spending index amounted to 0.4% on a monthly basis, which was in line with analysts' expectations. A year ago, we recall, it was 0.6%. Thus, statistics indicate a weakening of inflation which means that the likelihood of the Fed cutting interest rates increases — the anticipation of this event increases optimism in the stock market.
Another driver is the strong price action of NVDA stock. The company's capitalization is close to USD 2 trillion, as Nvidia is perhaps the main beneficiary of the AI boom — NVDA's price rose approximately 28% in February.
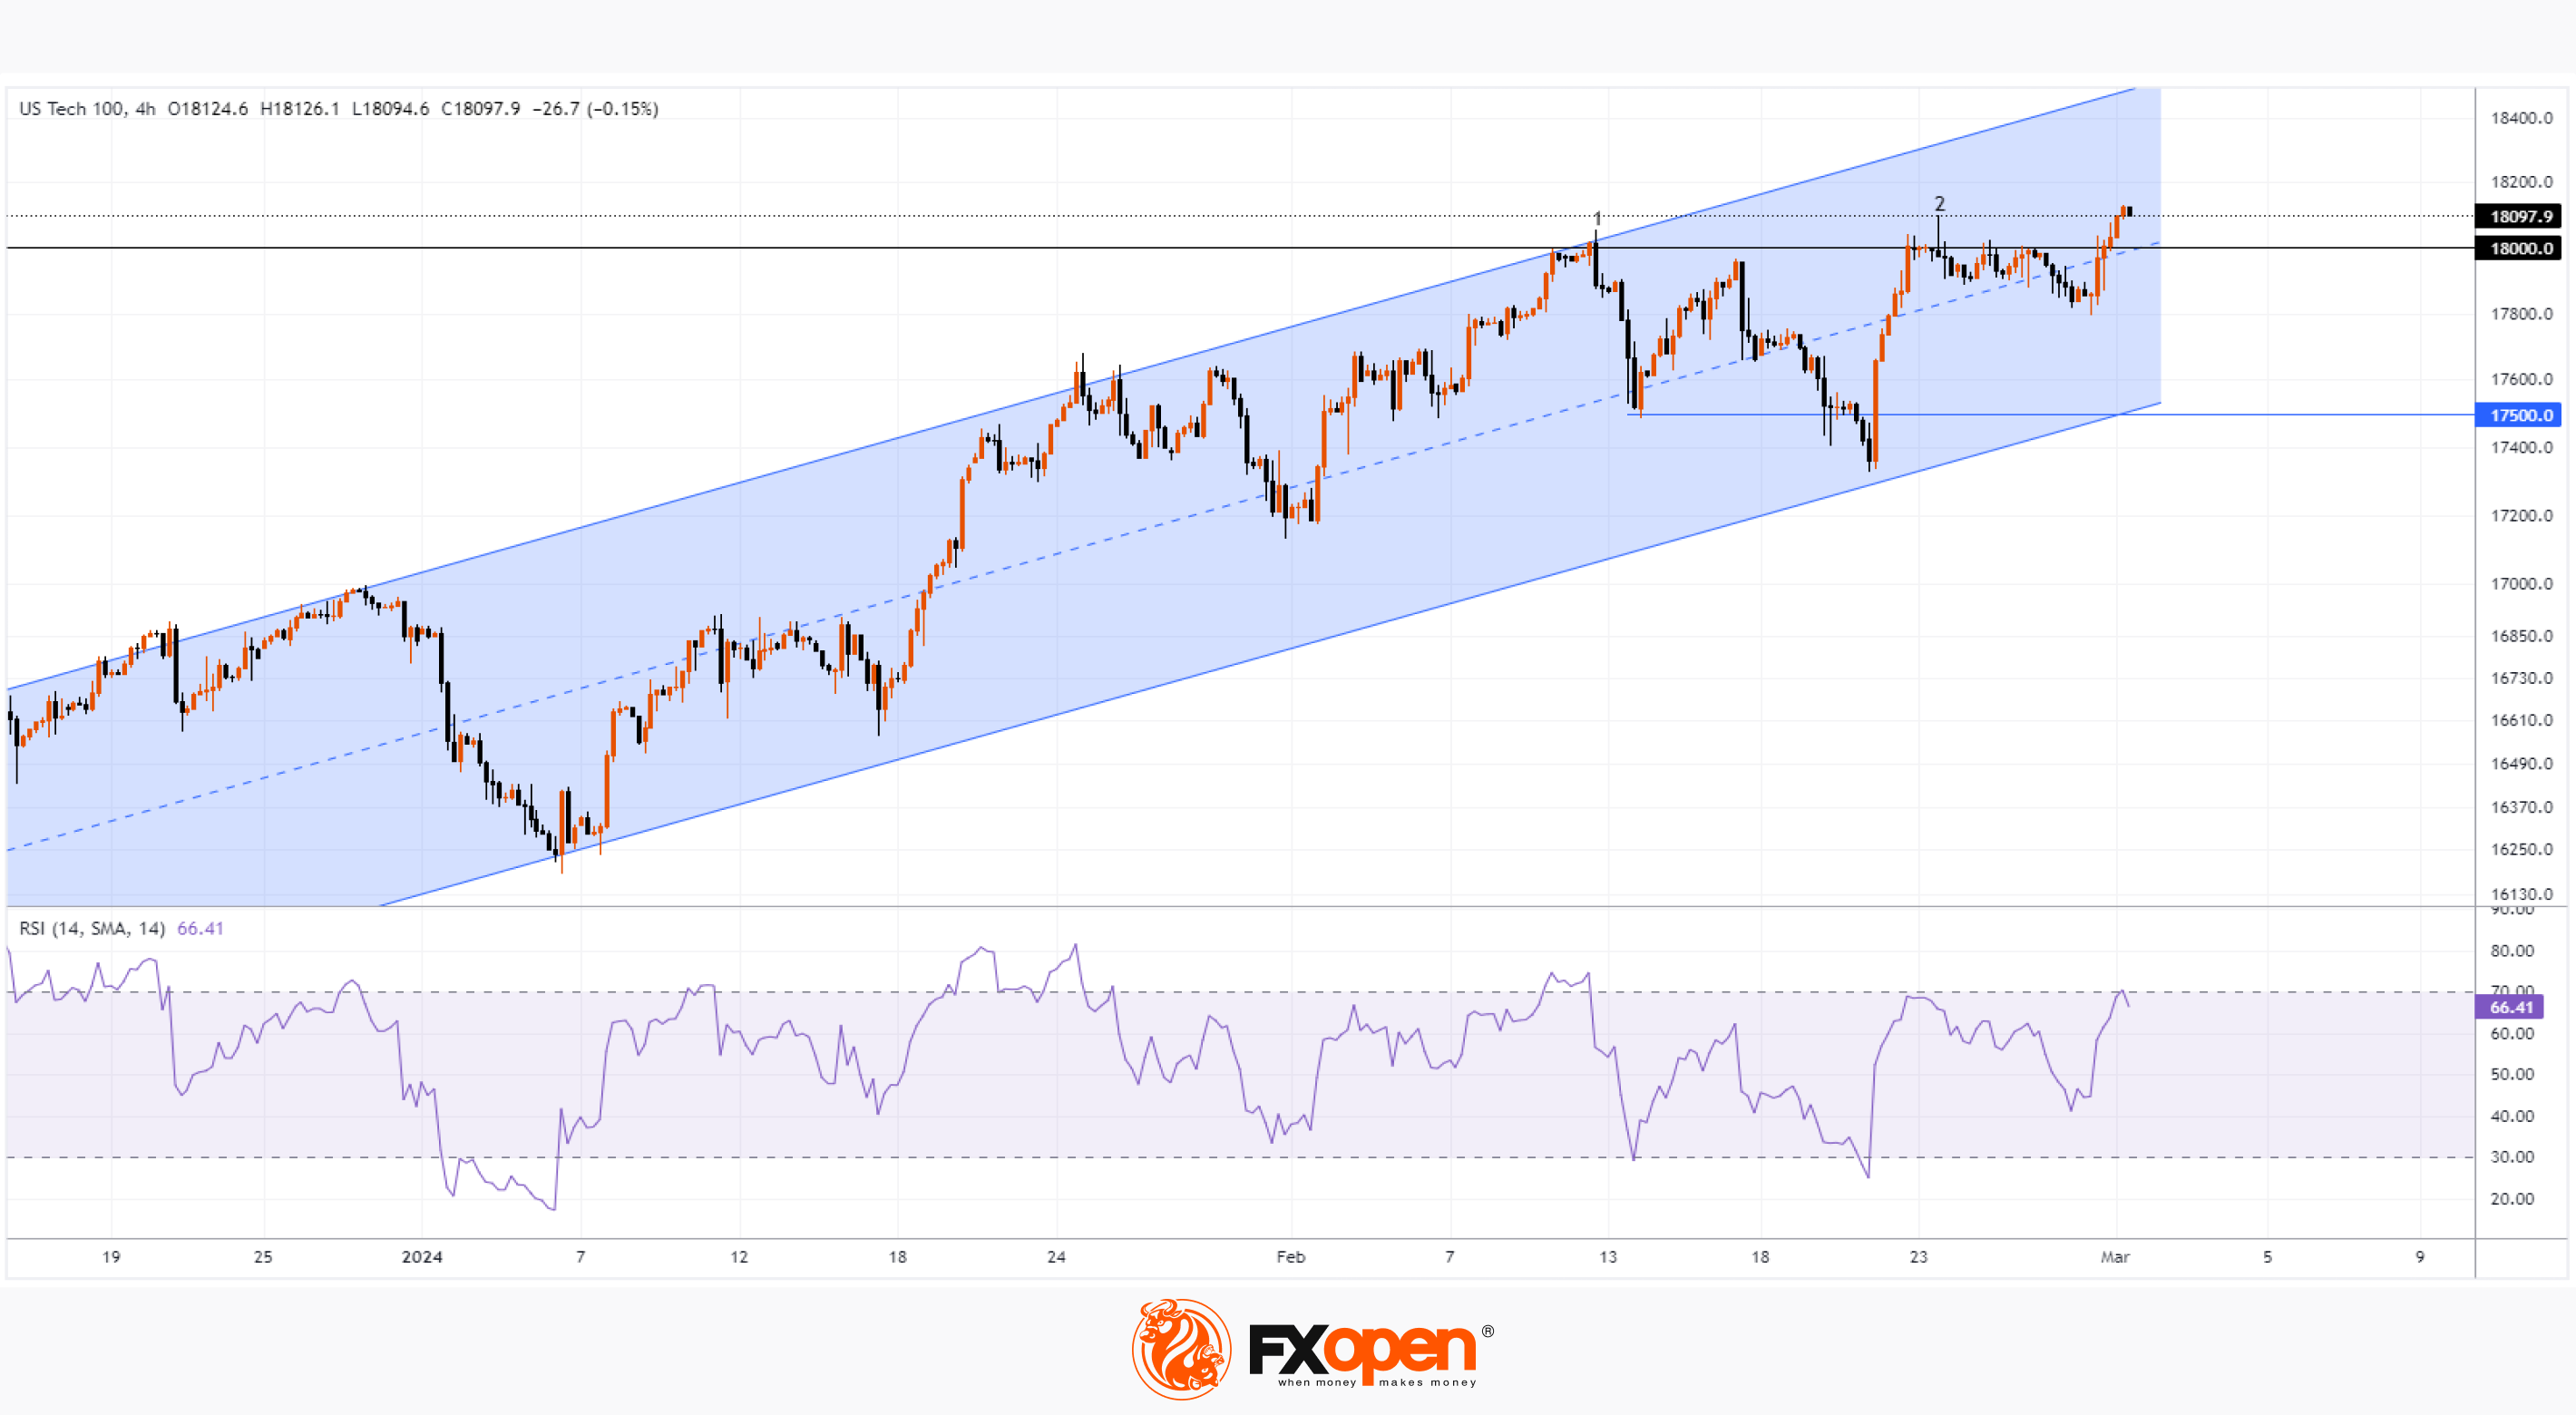
The Nasdaq-100 chart shows that the index price has been in an upward trend since the beginning of 2024 (shown by the blue channel):
→ with the price is in its upper half;
→ from the point of view of technical analysis of the Nasdsaq-100, the level of 18k points, which acted as resistance in February, may support the market in March — however, this is if the bulls manage to gain a foothold above 18,000.
In the meantime, the current exceeding of maximum 2 looks insignificant. And this creates the threat of a false bullish breakout — as an example, this turned out to be the maximum 2, when the price exceeded the maximum 1. Let's note another bearish factor, the overbought state on the RSI indicator.
Comments from FOMC committee members are expected this evening, which could impact current sentiment.
Trade global index CFDs with zero commission and tight spreads (additional fees may apply). Open your FXOpen account now or learn more about trading index CFDs with FXOpen.
This article represents the opinion of the Companies operating under the FXOpen brand only. It is not to be construed as an offer, solicitation, or recommendation with respect to products and services provided by the Companies operating under the FXOpen brand, nor is it to be considered financial advice.
Stay ahead of the market!
Subscribe now to our mailing list and receive the latest market news and insights delivered directly to your inbox.


Latest articles

Consolidation Ahead of NFP: Commodity Currencies Search for Direction
Commodity-linked currencies have entered a consolidation phase following recent directional moves, as market participants adopt a wait-and-see approach ahead of key US labour market data. Current price action reflects a balance between ongoing demand for the US dollar and attempts

The Real Driver Behind the Dollar Rally: Market Insights with Gary Thomson
The US dollar has been firm, but the drivers behind the move may be more complex than they first appear.
While geopolitical tension and shifts in risk sentiment play a role, current price behaviour seems increasingly influenced by inflation expectations

EUR/USD and USD/CHF Pull Back: Market Reacts to Fundamentals
European currencies have shown a recovery in recent trading sessions after their recent decline, displaying early signs of a reversal. The US dollar is weakening amid expectations surrounding upcoming US macroeconomic data, while market participants are reassessing their short-term positions